Quantcast
Channel: Severalnines - PostgreSQL
Viewing all 350 articles
Browse latest View live

Become a PostgreSQL DBA: PostgreSQL Server Configuration Parameters

$
0
0

PostgreSQL server configuration parameters play an important role in optimizing and enhancing database performance.

Usually in any environment, default parameters are not enough, and this is where an understanding of important server parameters can contribute greatly to influence database performance. Understanding these can be critical to reducing server downtime just for routine configuration changes, as well as making sure you're adjusting the parameter you want at the time when you want the change to take effect.

The main tunable settings for PostgreSQL are in a plain text file named postgresql.conf, that is located at the base of the database directory structure.

The majority of these configuration parameters are broadly classified under the following categories:

  1. Database Connection Parameters
  2. Logging Parameters
  3. Memory Parameters
  4. WAL Parameters
  5. Query Tuning Parameters

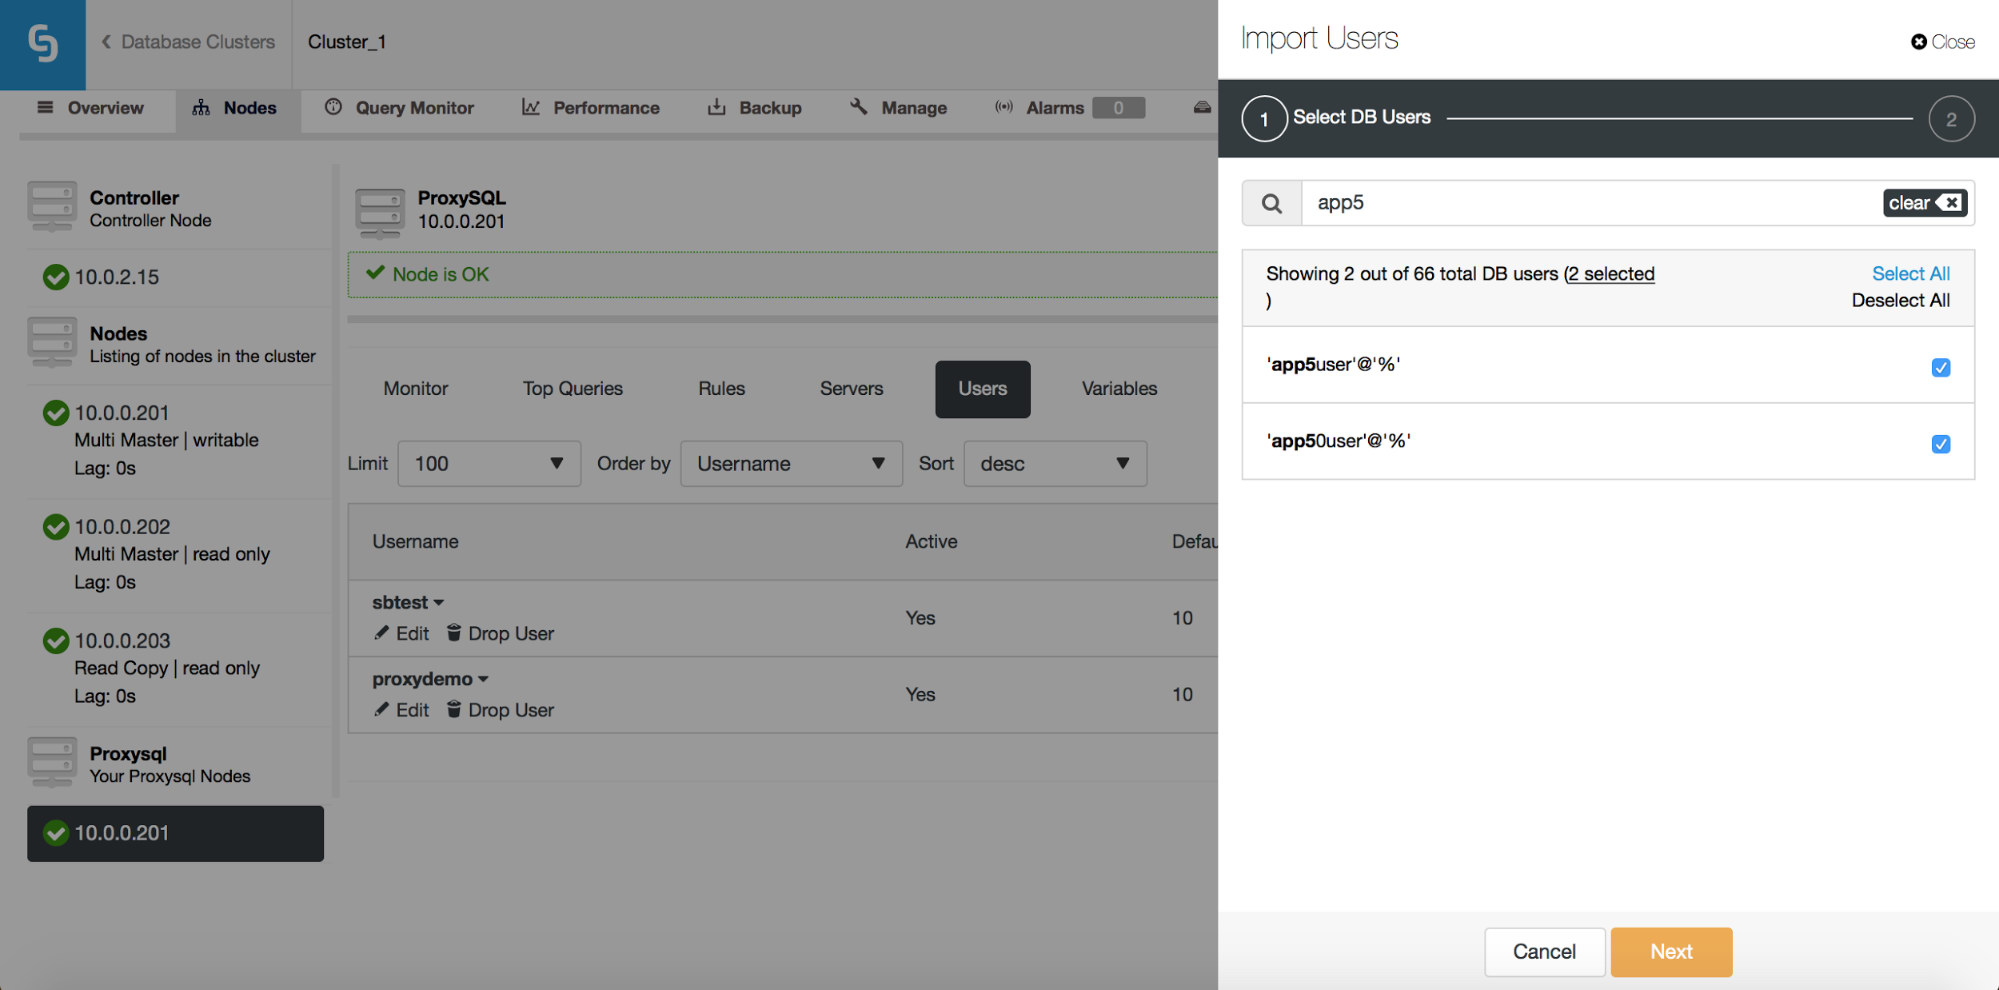
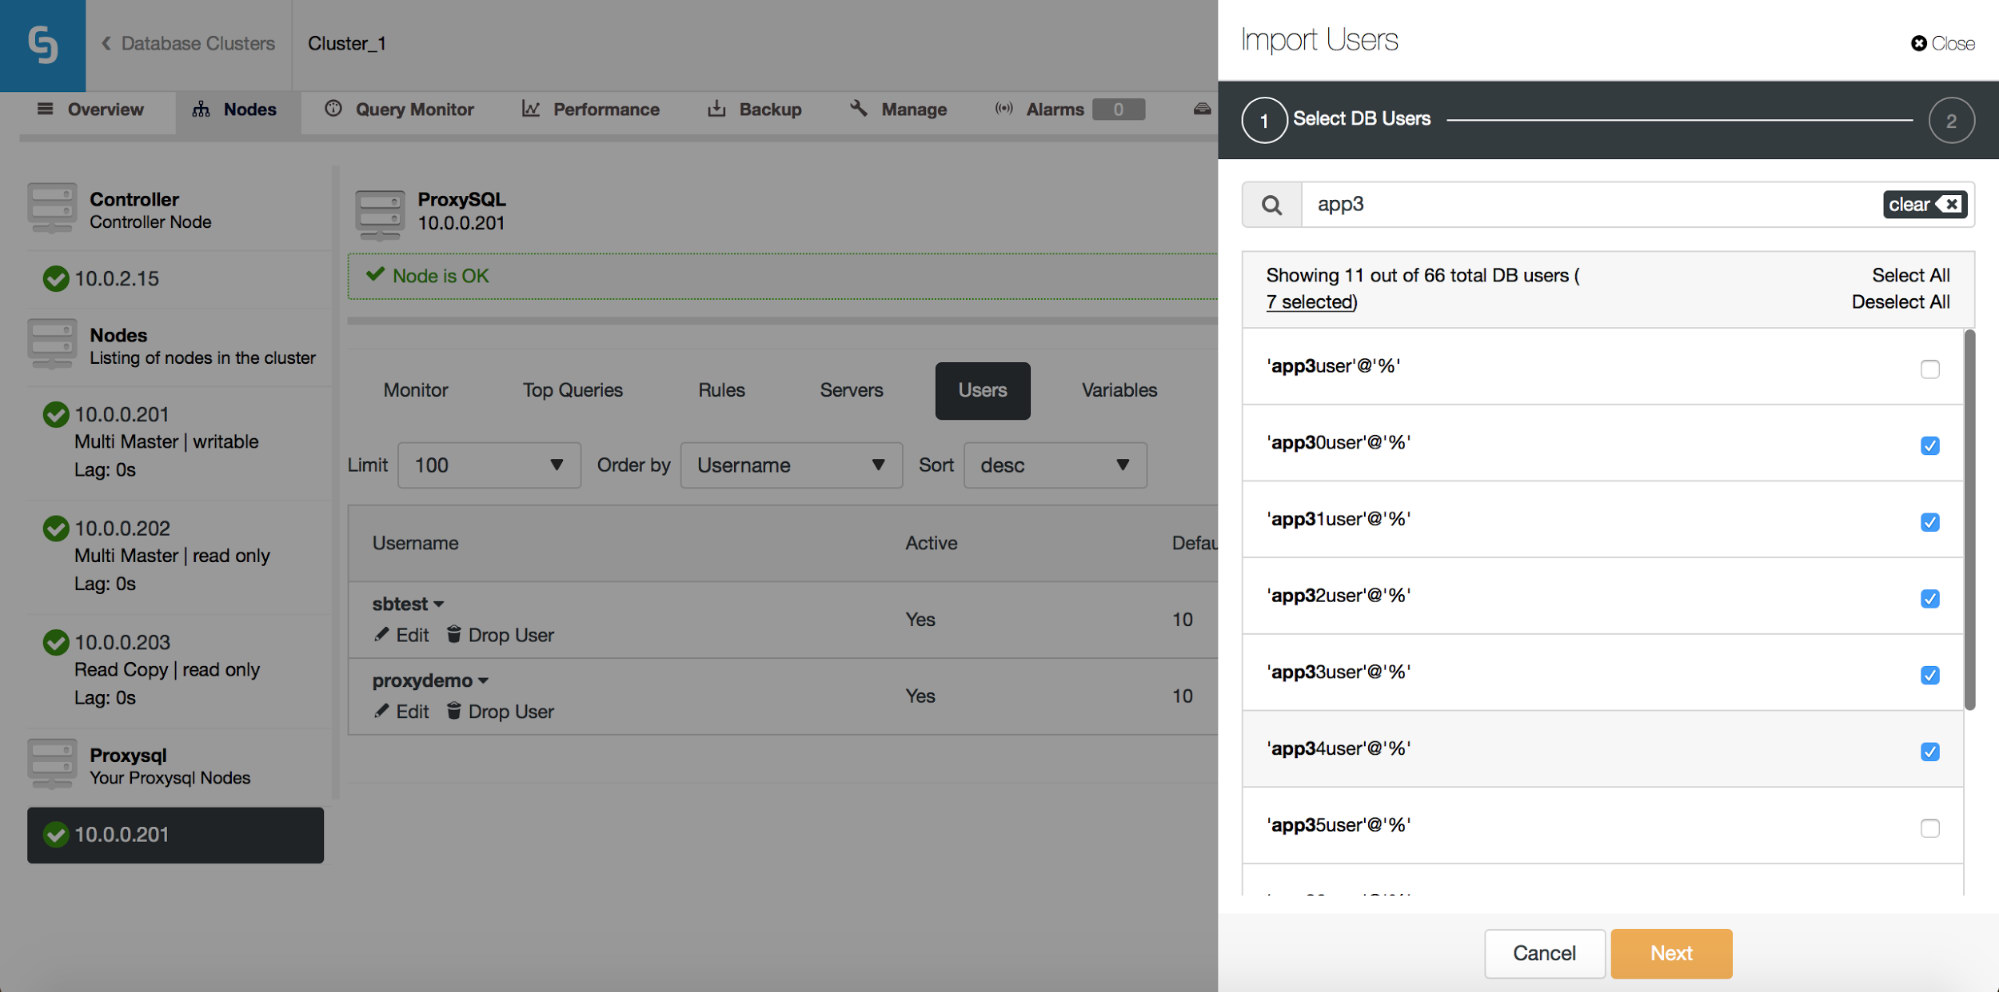
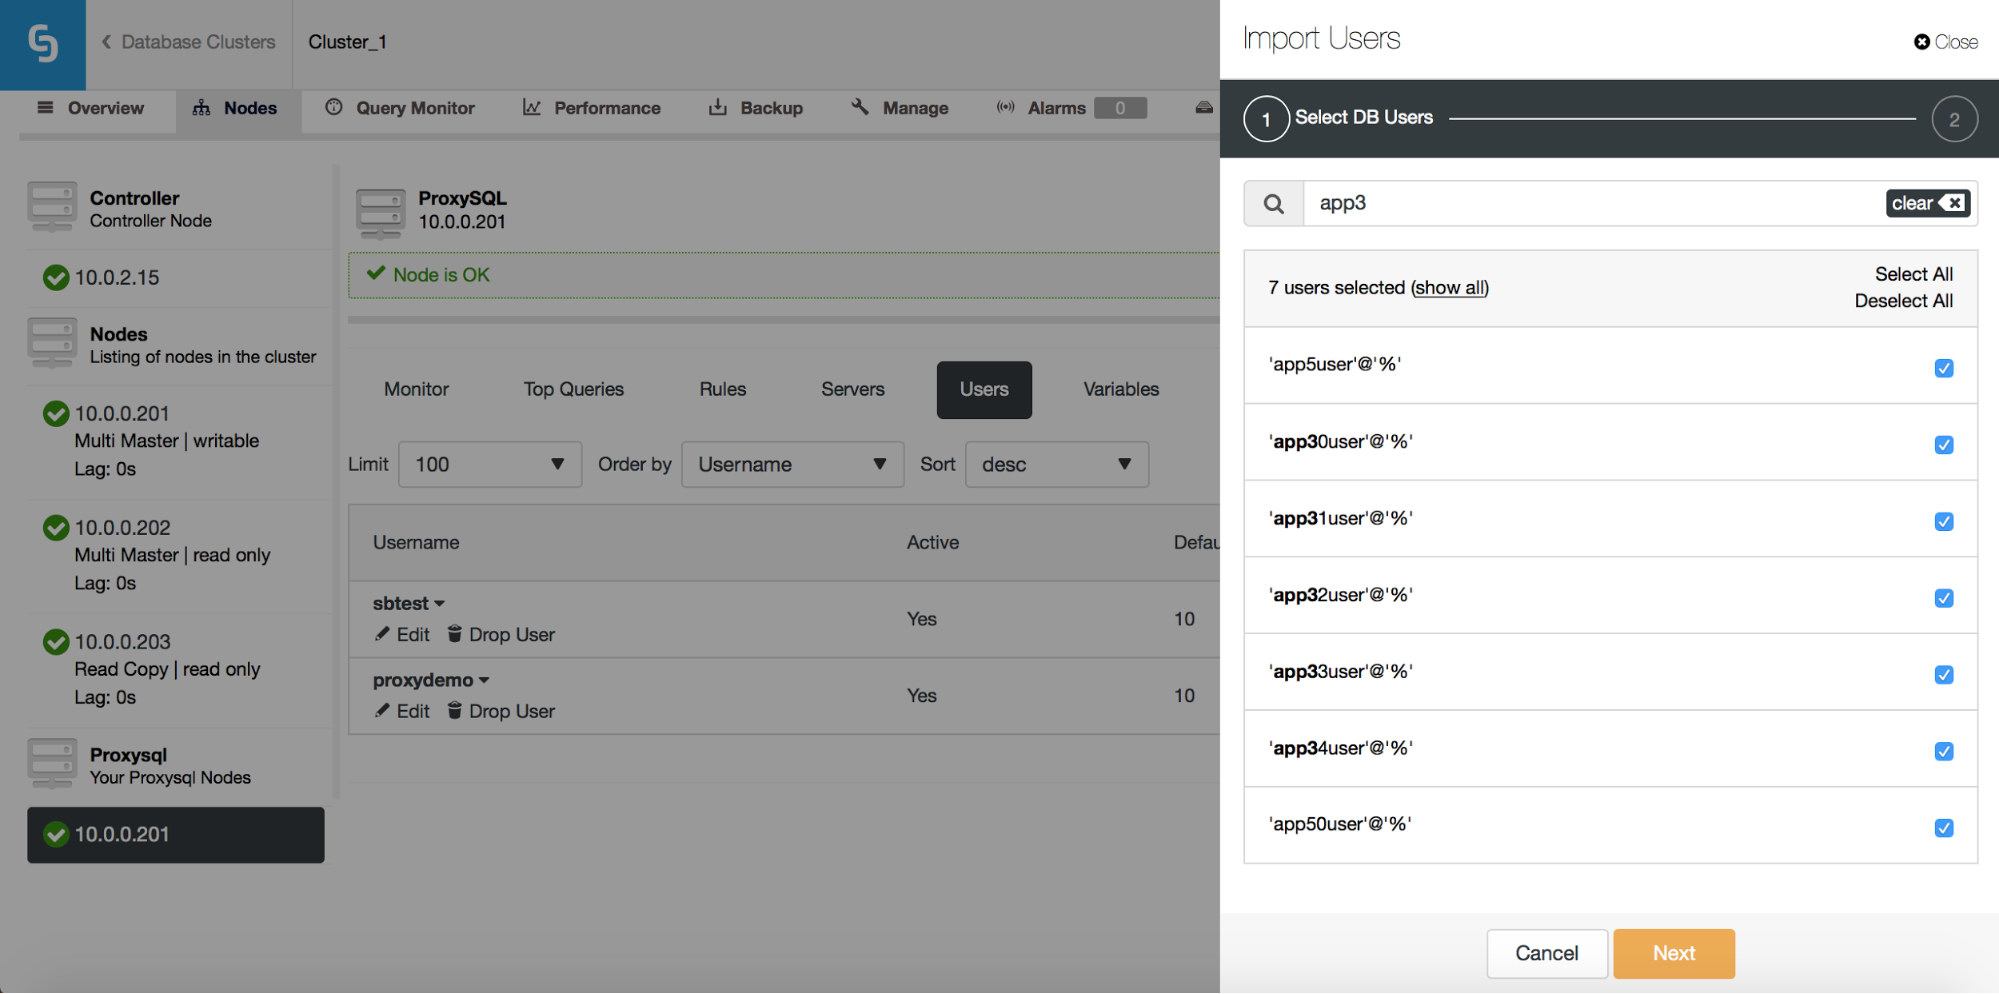
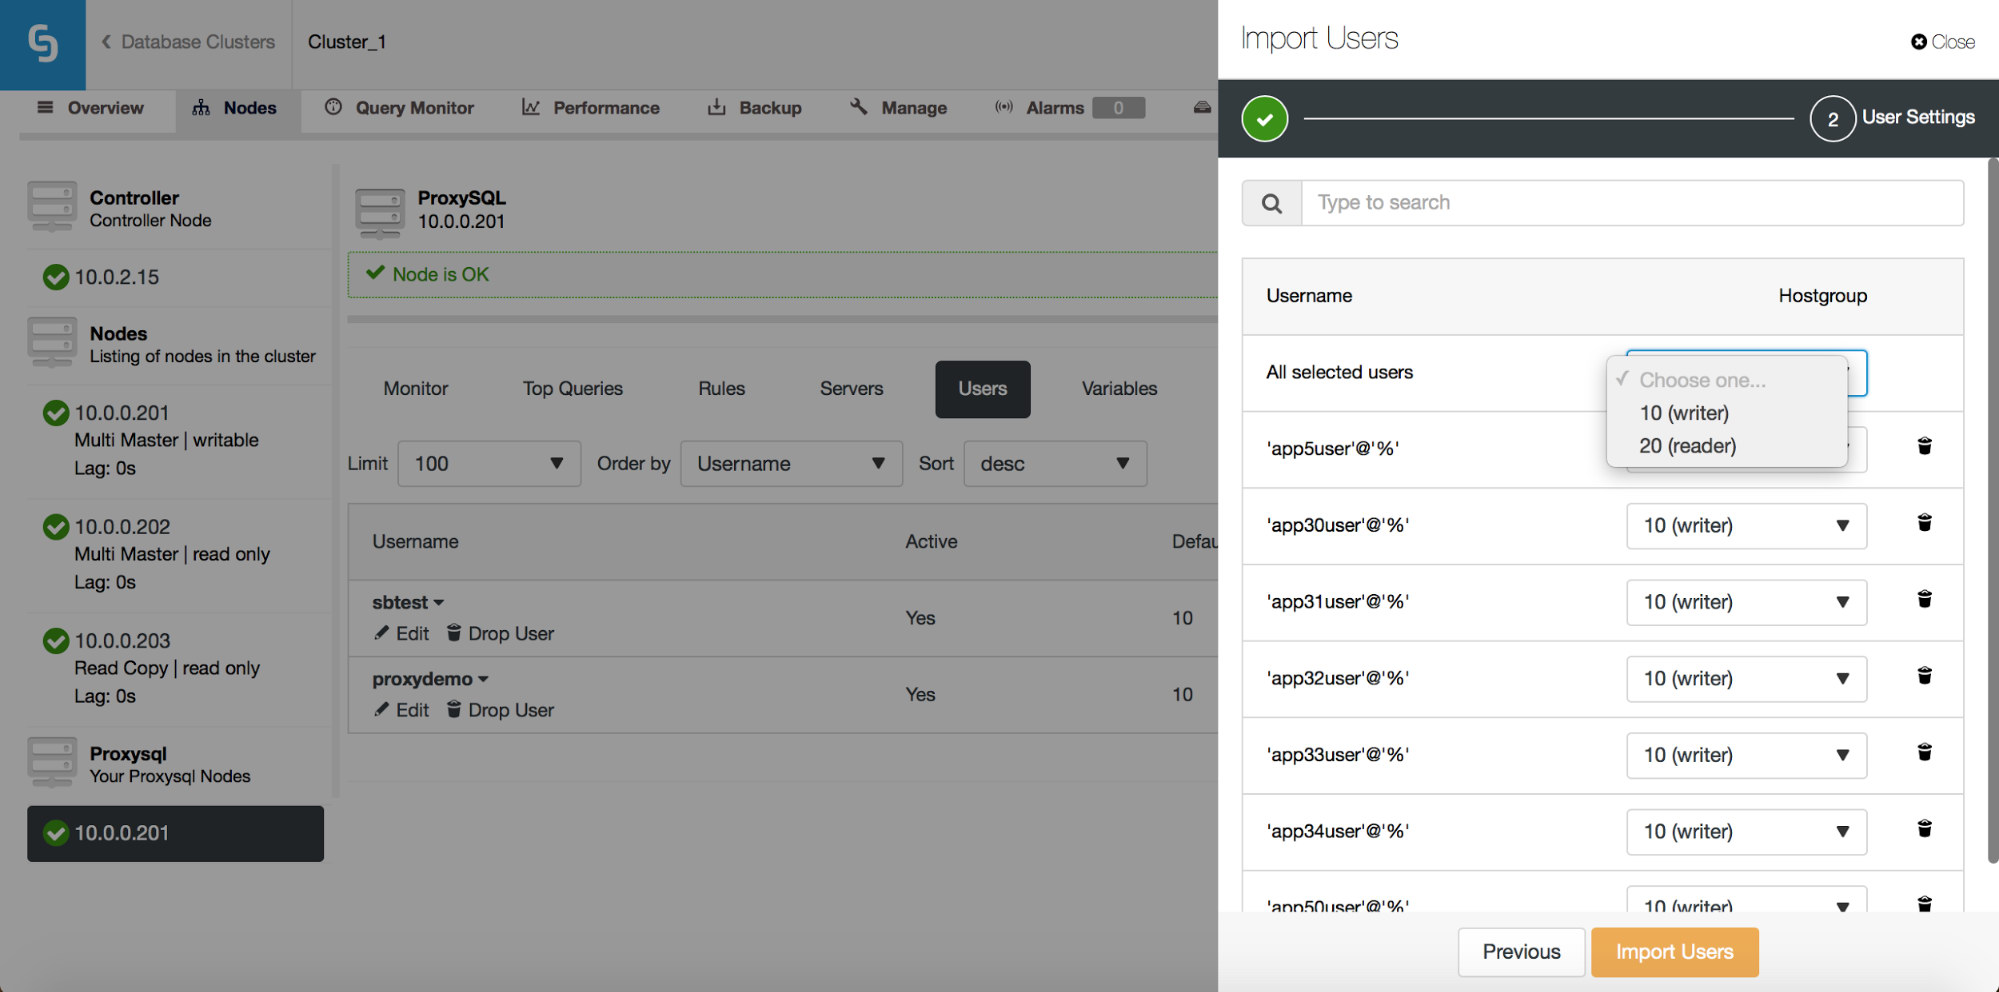
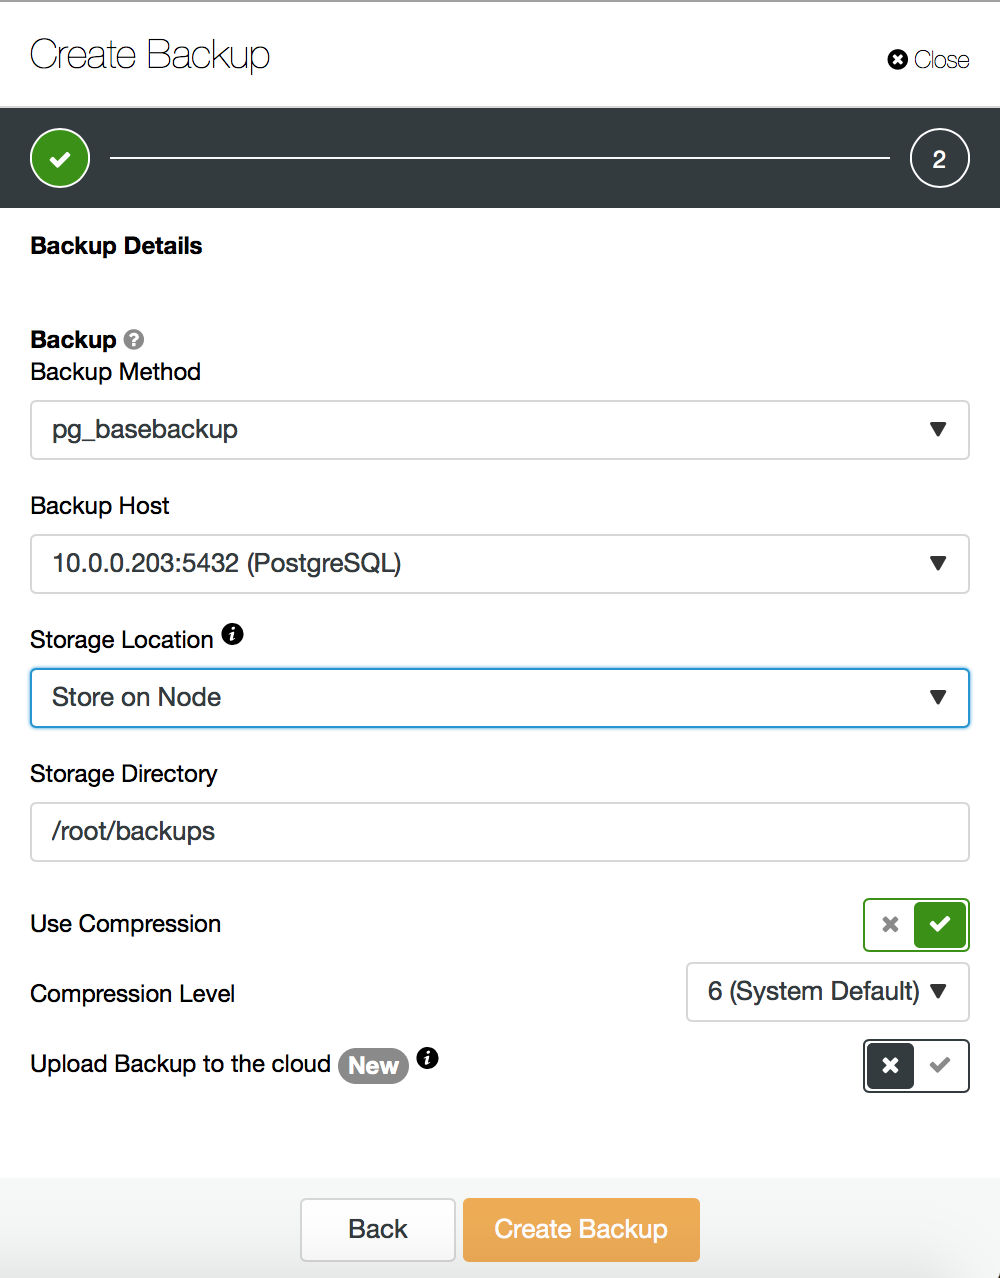
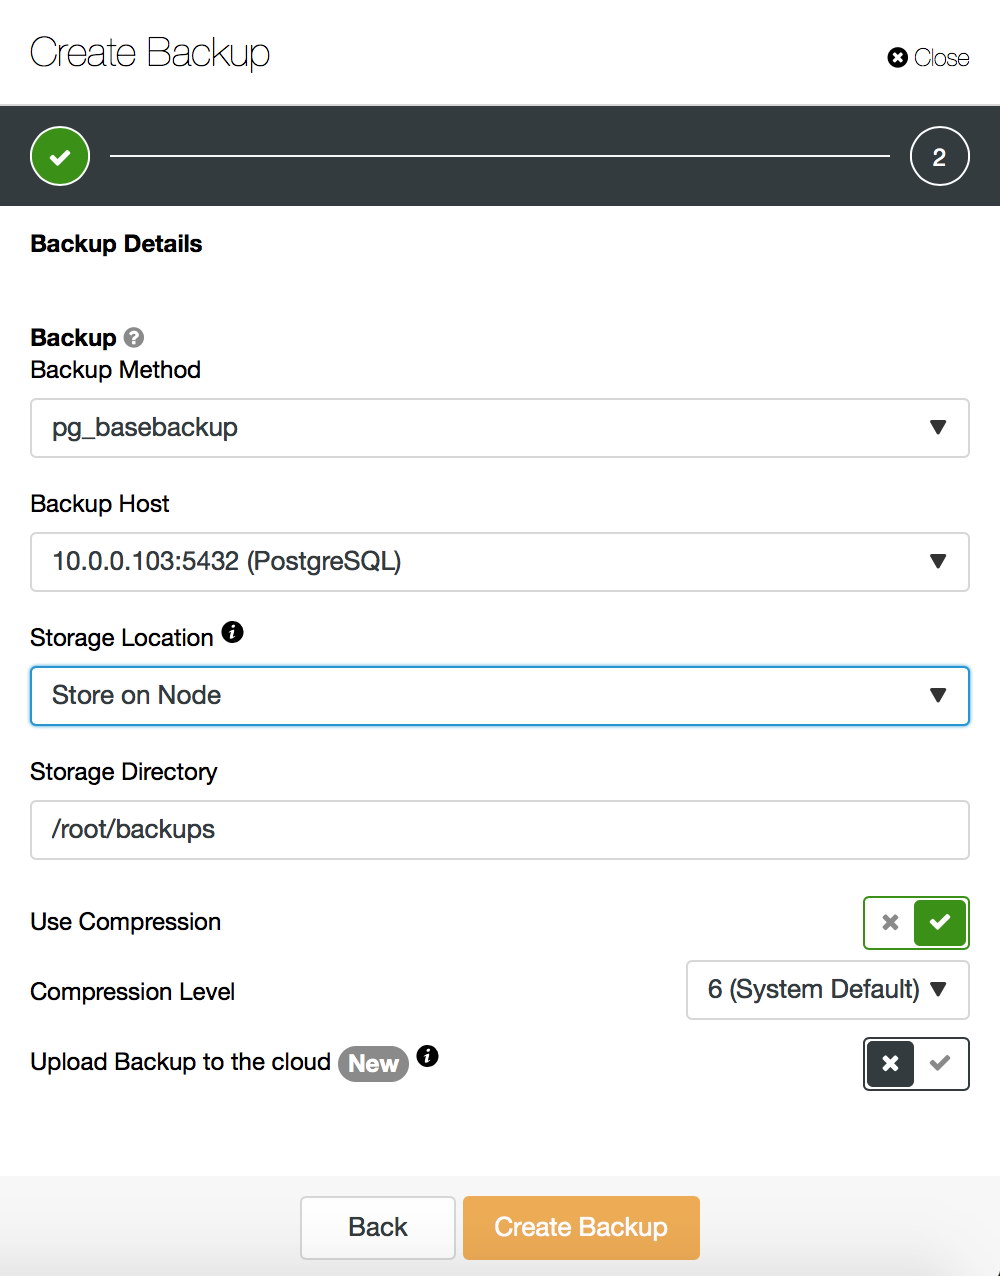
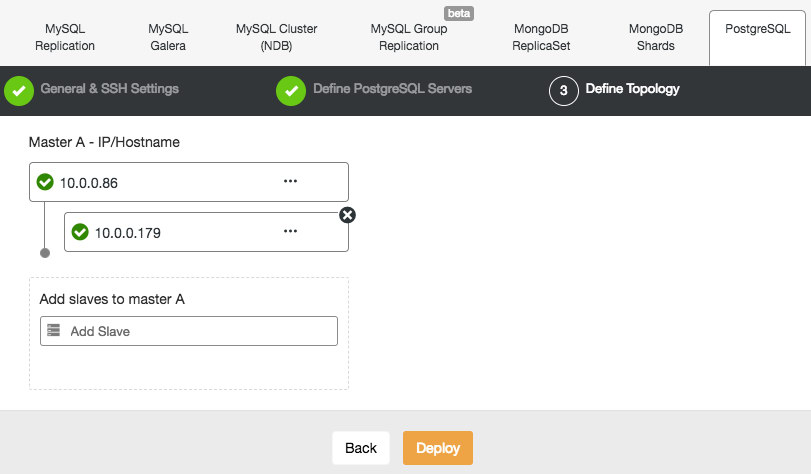
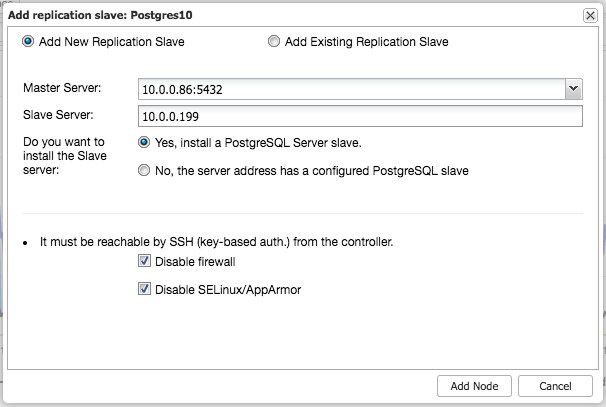
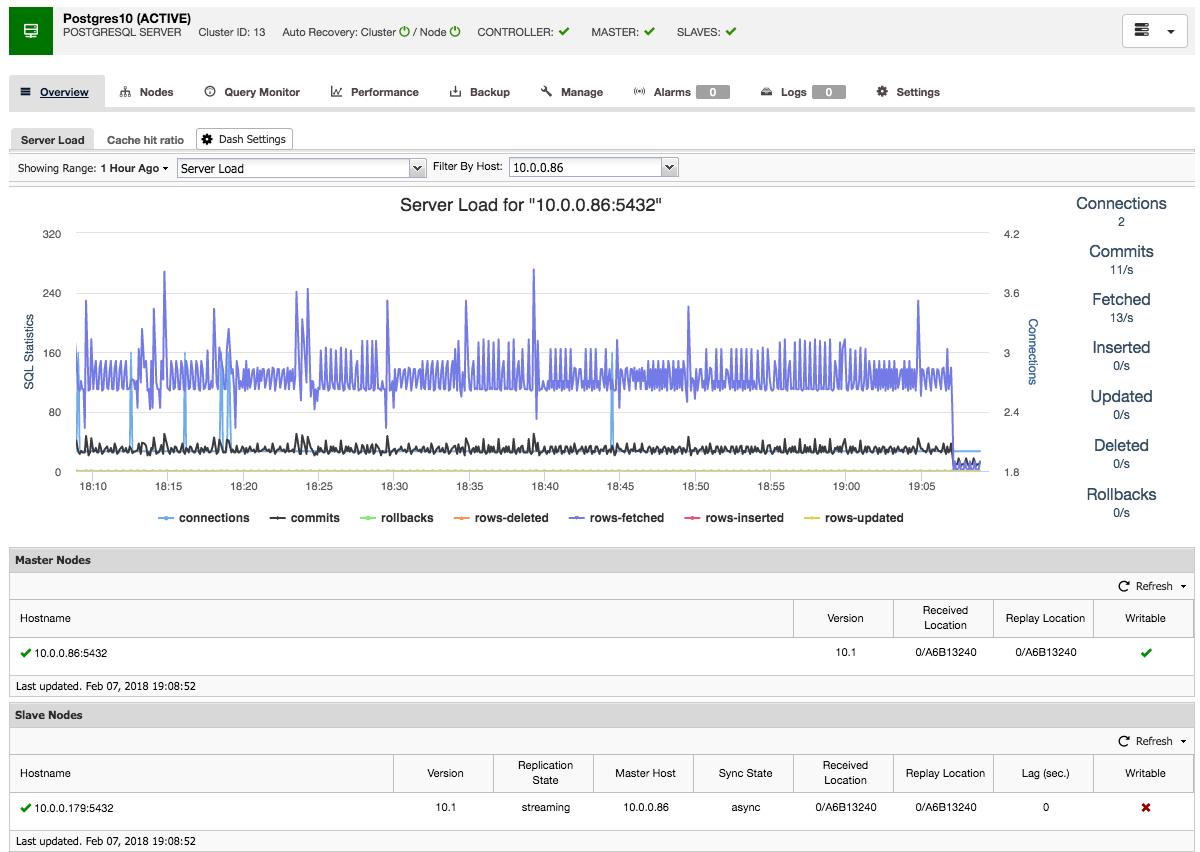
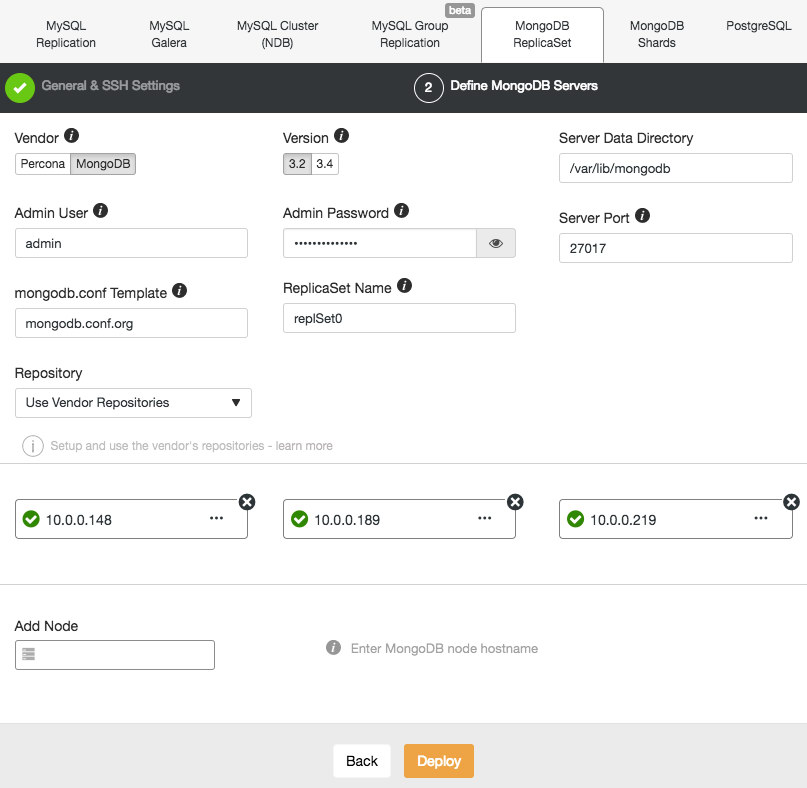
Most of these parameters can be changed by making the respective changes in the postgresql.conf file manually. A convenient way is to do the changes using ClusterControl. It allows to make the required configuration changes from the web interface, allowing for more fine grained control and without the need for the end user to locate and poke directly in the postgresql.conf file on the backend.

In this blog, we focus on connection, logging and memory parameters. The other categories are mostly from a system/query tuning perspective, we will look at these in subsequent blogs.

Connection Parameters

There are many configuration parameters that control how people can connect remotely and locally to the database.

listen_addresses

Any installation that requires a connection from a remote system will need to change listen_addresses to allow that. The default only allows local connections from users logged into the same system as the database server. A common approach is to accept incoming connections from anywhere-as far as the primary configuration file is concerned like this:

listen_addresses = '*'

max_connections

Max_connections is one of the settings that you'll always find set to a value, typically 100, in the postgresql.conf generated by initdb. Because each connection uses a small amount of shared memory,  it's possible for systems with particularly limited shared memory defaults to not even allow this many connections. Accordingly, some investigation is done by initdb when the database cluster is created, and then the largest value supported - up to 100 - is saved into the default configuration. In practice, the amount of non-shared memory each client uses for things such as sorting will dwarf this, but the shared component cannot be completely ignored.

It is important not to set this parameter to a value much higher than you need it to be. There are several downsides to larger settings. The first is wasted shared memory, typically the last of the things to be concerned about as the amount per connection is small.

Logging Parameters

The general logging setup is vital and important as logging can play a crucial role in debugging error, warning and other system issues. You may need to set parameters such as log_destination, log_directory, and log_filename to save your log files in a way that is compatible with the system administration requirements of your environment. On most systems these will all be set to reasonable defaults to get started. On UNIX-like systems, it's common for some of the database logging to be set in the script that starts and stops the server, rather than directly in the postgresql.conf file.

log_line_prefix

The default log_line_prefix parameter is empty, which is not what you want. A good starting value here is the following:

log_line_prefix='%t:%r:%u@%d:[%p]: '

This will put the following into every log line:

%t: Timestamp
%u: Database username
%r: Remote host connection
%d: Database
%p: Process ID of connection

It may not be immediately obvious what you'd want all of these values for, particularly the process ID. Once you've tried to chase down a few performance issues, the need for saving these values will be more obvious, and you'll be glad to already have this data logged.

log_statement

Statement logging is a powerful technique for finding performance issues. Analyzing the information saved by log_statement and related sources for statement-level detail can reveal the true source of many types of performance issues.

The options for this setting are as follows:

none: Do not log any statement-level information.

ddl: Log only data definition language (DDL) statements such as CREATE and DROP. This can normally be left in, even in production, and can be used to catch major changes introduced accidentally or intentionally by administrators.

mod: Log any statement that modifies a value, which is essentially everything except for simple SELECT statements. If your workload is mostly SELECT-based with relatively few data changes, it may be practical to leave this enabled all the time.

all: Log every statement. This is generally impractical to leave on in production due to the overhead of the logging. However, if your server is powerful enough relative to its workload, it may be practical to keep it on all the time.

log_min_duration_statement

Once you have some idea of how long a typical query statement should take to execute, this setting allows you to log only the ones that exceed the threshold you set. The value is in milliseconds, so you might set the following:

log_min_duration_statement=1000

With this, you'll only see statements that take longer than 1 second to run. This can be extremely handy for finding out the source of outlier statements that take much longer than most to execute.

ClusterControl
Single Console for Your Entire Database Infrastructure
Find out what else is new in ClusterControl

Memory Parameters

Database components require memory for caching frequently accessed data, transaction logging and for sorting data. Hence it is critical that memory parameters be tuned correctly as it can help optimize database performance.

shared_buffers

The value of this parameter defines the size of the PostgreSQL shared buffer pool. In other words, this parameter governs the amount of memory to be used by PostgreSQL for caching data. The default value of 128 MB is quite low for any real world workload and needs to be beefed up. This value should be set based on the dataset size, which the database server is supposed to handle at peak loads and on the basis of the available RAM. The defacto rule of thumb is that, on systems with more than 1GB of RAM, a reasonable value for this parameter would be around one fourth of the system memory. The value of this parameter can also be set to a larger value and will be ideally effective up to a maximum setting of 40% of the available RAM. But increasing it beyond that limit may not be effective because PostgreSQL also relies on the operating system cache as well for its operations. A large value for the shared_buffers parameter would mean an increase in the checkpoint_segments value, in order to spread out the process of writing large quantities of new or changed data over a period of time.This value can only be set at server start.

temp_buffers

This parameter defines the amount of memory to be used by each database session for caching temporary table data. These are basically session local buffers, used only for access to temporary tables. The default value of this parameter is eight in Postgresql version 9.4, and this setting can be changed within individual sessions but only before the first use of temporary tables within the session. Any subsequent attempts to change the value will have no effect on the existing session.

maintenance_work_mem

This parameter defines the maximum amount of memory to be used by maintenance operations, i.e., VACUUM , CREATE INDEX, ALTER TABLE ADD FOREIGN KEY operations which need more working memory. The catch is that it is unlikely to be seen that many of these sessions will be doing these operations at the same time, so it is possible to set this value to a much larger value than the standard per client work_mem setting. The default value of this parameter is set to 64MB in PostgreSQL version 9.4. One thing to be noted here is that, when autovacuum runs, a value of autovacuum_max_workers times this memory gets allocated. From the point of optimization and considering that one has not increased the number of autovacuum workers, a good configuration setting would be to set this to around 5 % of the total system memory so that even five such processes would not exceed a quarter of the available memory. This approximately works out to 50 MB of maintenance_work_mem per GB of the server's system memory.


Become a PostgreSQL DBA: Best Community Tools for PostgreSQL

$
0
0

ClusterControl allows you to easily deploy and configure master/slave replication PostgreSQL instances, monitor queries and detect anomalies with built-in alerts, and lets you manage configurations, schedule & restore backups. It even has advanced failover handling that detects master failures and automatically promotes a new master.

Even though ClusterControl offers many rich features for managing PostgreSQL instances there are some activities that you may want to perform that it doesn’t yet do.

In this blog we will cover many different PostgreSQL tool categories and the most widely used tools in each category. While most of the tools we share are open source, some have nominal costs associated with them.

Most PostgreSQL tools are classified under the following categories...

  1. Backup And Recovery Tools
  2. Monitoring Tools
  3. Logical and Trigger Based Replication Tools
  4. Multimaster Replication Tools
  5. High Availability And Failover Tools
  6. Connection Pooling Tools
  7. Table Partitioning Tools
  8. Migration Tools

Backup And Recovery Tools

Barman

Barman (Backup and Recovery Manager) is an open-source administration tool for disaster recovery of PostgreSQL servers written in Python.It allows your organisation to perform remote backups of multiple servers in business critical environments and help DBAs during the recovery phase.Barman’s most wanted features include backup catalogs, incremental backup, retention policies, remote recovery, archiving and compression of WAL files and backups.Barman is written and maintained by PostgreSQL professionals at 2ndQuadrant.

EDB BART

EDB Backup and Recovery Tool (BART) is a key component of an enterprise-level Postgres-based data management strategy. BART implements retention policies and point-in-time recovery requirements for large-scale Postgres deployments. Bart 2.0 VERSION provides block-level incremental backups.

PgBackRest

pgBackRest aims to be a simple, reliable backup and restore system that can seamlessly scale up to the largest databases and workloads. Instead of relying on traditional backup tools like tar and rsync, pgBackRest implements all backup features internally and uses a custom protocol for communicating with remote systems. Removing reliance on tar and rsync allows for better solutions to database-specific backup challenges. The custom remote protocol allows for more flexibility and limits the types of connections that are required to perform a backup which increases security.

Monitoring Tools

POWA

PoWA is PostgreSQL Workload Analyzer that gathers performance stats and provides real-time charts and graphs to help monitor and tune your PostgreSQL servers.It is similar to Oracle AWR or SQL Server MDW.

PgCluu

pgCluu is a PostgreSQL performances monitoring and auditing tool.View reports of all statistics collected from your PostgreSQL databases cluster. pgCluu will show you the entire information of the PostgreSQL Cluster and the system utilization.

Pgwatch2

Pgwatch2 is one of the easiest monitoring tools to be used for PostgreSQL monitoring.It is based on Grafana and offers out of the box monitoring for PostgreSQL databases. Due to the use of containers, pgwatch 2 can be installed in minutes without having to worry about dependencies and complex installation procedures. It is pre-configured. All it needs is a database connection and you are ready to go.

Logical and Trigger Based Replication Tools

pgLogical

pglogical is a logical replication system implemented entirely as a PostgreSQL extension. Fully integrated, it requires no triggers or external programs. This alternative to physical replication is a highly efficient method of replicating data using a publish/subscribe model for selective replication.

Slony-I

Slony-I is a "master to multiple slaves" replication system for PostgreSQL supporting cascading replication. The big picture for the development of Slony-I is that it is a master-slave replication system that includes all features and capabilities needed to replicate large databases to a reasonably limited number of slave systems.

Slony-I is a system designed for use at data centers and backup sites, where the normal mode of operation is that all nodes are available.

Bucardo

Bucardo is an asynchronous PostgreSQL replication system, allowing for both multi-master and multi-slave operations. It was developed at Backcountry.com by Jon Jensen and Greg Sabino.

Multimaster Replication Tools

BDR

Bi-Directional Replication for PostgreSQL (Postgres-BDR, or BDR) is the first open source multi-master replication system for PostgreSQL to reach full production status. Developed by 2ndQuadrant, BDR is specifically designed for use in geographically distributed clusters, using highly efficient asynchronous logical replication, supporting anything from 2 to more than 48 nodes in a distributed database.

High Availability And Failover Tools

Repmgr

repmgr is an open-source tool suite for managing replication and failover in a cluster of PostgreSQL servers. It enhances PostgreSQL's built-in hot-standby capabilities with tools to set up standby servers, monitor replication, and perform administrative tasks such as failover or manual switchover operations.repmgr was designed by 2ndQuadrant.

PAF

PostgreSQL Automatic Failover is a new OCF resource Agent dedicated to PostgreSQL. Its original wish is to keep a clear limit between the Pacemaker administration and the PostgreSQL one, to keep things simple, documented and yet powerful. Once your PostgreSQL cluster is built using internal streaming replication, PAF is able to expose to Pacemaker what is the current status of the PostgreSQL instance on each node: master, slave, stopped, catching up, etc. Should a failure occur on the master, Pacemaker will try to recover it by default. Should the failure be non-recoverable, PAF allows the slaves to be able to elect the best of them (the closest one to the old master) and promote it as the new master.

Patroni

Patroni is a template for you to create your own customized, high-availability solution using Python and - for maximum accessibility - a distributed configuration store like ZooKeeper, etcd or Consul. Database engineers, DBAs, DevOps engineers, and SREs who are looking to quickly deploy HA PostgreSQL in the datacenter-or anywhere else-will hopefully find it useful.

Stolon

stolon is a cloud native PostgreSQL manager for PostgreSQL high availability. It's cloud native because it'll let you keep an high available PostgreSQL inside your containers (kubernetes integration) but also on every other kind of infrastructure (cloud IaaS, old style infrastructures etc.).

Connection Pooling Tools

PgBouncer

This is a very popular connection pool written by Skype developers in 2007. The project has been maintained by various developers in subsequent years, but its role of lowering the cost of connecting to PostgreSQL has never changed.PgBouncer allows PostgreSQL to interact with orders of magnitude more clients than is otherwise possible because its connection overhead is much lower. Instead of huge libraries, accounting for temporary tables, query results, and other expensive resources, it essentially just tracks each client connection in a queue. Then, based on configuration settings, it creates several PostgreSQL connections and assigns them to the connections on a first-come, first-served basis.

PgPool-II

The next pooling resource we will explore is named pgpool-II, but we'll refer to it simply as pgpool. This is another popular connection proxy, but it predates PgBouncer by almost a year, having been available since late 2006. The scope of pgpool is also much larger, providing functionality such as query-based replication, connection pooling, load balancing, parallel-query, and more. One feature pgpool exposes, is server pooling. If we have two PostgreSQL servers, we can make use of a virtual IPaddress so that clients need not modify configuration files when we switch the primary database server. However, in order to move the IP address between servers, it must first be removed from one server and recreated on the other. This disconnects all active clients and causes a small disruption in availability.However, pgpool can pool servers so that the active primary server is hidden from database clients. We can promote the secondary within pgpool, and it will handle failover internally. From the application or client's perspective, the database was never offline.

PostgreSQL Table Partitioning Tools

Pg_Partman

pg_partman is an extension to create and manage both time-based and serial-based table partition sets. Sub-partitoning is also supported. Child table & trigger function creation is all managed by the extension itself. Tables with existing data can also have their data partitioned in easily managed smaller batches. Optional retention policy can automatically drop partitions no longer needed. A background worker (BGW) process is included to automatically run partition maintenance without the need of an external scheduler (cron, etc) in most cases.

pg_Pathman

The pg_pathman is a Postgres Pro extension that provides an optimized partitioning solution for large and distributed databases. Using pg_pathman, you can partition large databases without downtime, speed up query execution for partitioned tables, manage existing partitions and add new partitions on the fly, add foreign tables as partitions, and join partitioned tables for read and write operations.

Migration Tools

Ora2pg

Ora2Pg is a free tool used to migrate an Oracle or MySQL database to a PostgreSQL compatible schema. It connects your Oracle database, scans it automatically and extracts its structure or data, it then generates SQL scripts that you can load into your PostgreSQL database. Ora2Pg can be used from reverse engineering Oracle database to huge enterprise database migration or simply to replicate some Oracle data into a PostgreSQL database. It is really easy to use and doesn't need any Oracle database knowledge than providing the parameters needed to connect to the Oracle database.


We hope you found this list of the best PostgreSQL tools useful. Do you have any that you use that we did not mention in our list? If so mention them in the comments below!

Become a PostgreSQL DBA: Adding Additional Nodes To a Replication Setup

$
0
0

Master-slave replication setups can be very useful, as they provide multiple copies of the data for high availability or for scale out purposes. Master slave replication setups can be very useful as they provide multiple copies of the data from a redundancy perspective. In this blog post, we will show you how you can simplify the process of configuring additional slaves nodes to an existing PostgreSQL setup. We will use ClusterControl, which makes the process look easy and almost seamless. One of the prerequisites is passwordless SSH from the ClusterControl node to all new slave nodes.

In order to configure a new slave node, the first step is to choose the Add Replication Slave option from the drop down list in the Overview page

On clicking the Add Replication Slave option, a dialog box is displayed where we need to input the corresponding master host information along with the new slave host information. You can also specify whether you want ClusterControl to install PostgreSQL on the slave host, or if it should use an existing PostgreSQL instance.

Once you click on Add Node button, a job will be spawned. The job status can be viewed by clicking on the Activity menu option as shown below.

Once the job is finished, you will see a list of messages on the screen indicating whether a new PostgreSQL slave node has been successfully deployed or not. As a sanity check, we can confirm the same by clicking on the Nodes menu option. We can see that the new slave node with IP Address 192.168.179.129 is visible under the nodes tab.

That’s it, you’re all good to go.

Announcing ClusterControl 1.5 - Featuring Automatic Backup Verification and Cloud Upload

$
0
0

Today we are excited to announce the 1.5 release of ClusterControl - the all-inclusive database management system that lets you easily deploy, monitor, manage and scale highly available open source databases - and load balancers - in any environment: on-premise or in the cloud.

ClusterControl 1.5 provides an array of exciting new backup functionalities to ensure that your data is secure and available whenever disaster strikes. The release also provides expanded PostgreSQL, MariaDB and MySQL NDB Cluster support.

Release Highlights

Cloud Services (AWS S3 and Google Cloud Storage)

  • Manual upload or schedule backups to be uploaded after completion to the cloud.
  • Download and restore backups from a cloud storage.

Backup (MySQL)

  • Backup individual databases separately (mysqldump only).
  • Upload, download and restore backups stored in the cloud.
  • Trigger a verification and restore of a backup after N hours of completion.
  • Rebuild a replication slave by staging it from an existing backup.
  • Add a new replication slave by staging it from an existing backup.

PostgreSQL

  • New backup method pg_basebackup which makes a binary copy of the database files.
  • Synchronous replication failover (support for synchronous_standby_names).
  • Support for HAProxy with Keepalived.
  • Support for PostgreSql 10.

ProxySQL

  • Mass import existing database users into ProxySQL.
  • Add and modify scheduler scripts.

Misc

  • MariaDB v10.2 support (Galera and MySQL Replication).
  • MySQL Cluster(NDB) v7.5 support.
  • Added support to show and filter DB status variables for MongoDB nodes.
  • HTML formatted alarm and digest emails.
  • Multiple NICs supports when deploying Load balancers (HAProxy).
  • Continuous improvements to UX/UI and performance.
  • New cmon-cloud process and clud client to handle cloud services.
  • New Ops Report: Database Growth
ClusterControl
Single Console for Your Entire Database Infrastructure
Find out what else is new in ClusterControl

View Release Details and Resources

New and Enhanced Backup Functions

ClusterControl 1.5 marks the first steps towards providing full seamless integration between ClusterControl and the Cloud. It provides our users with the options of migrating their data to the cloud while still benefiting from the features and functionality that ClusterControl has to offer.

  • AWS & Google Cloud Services Integration: ClusterControl now offers full integration for database backups for Amazon Web Services (AWS) and Google Cloud Services. Backups can now be executed, scheduled, downloaded and restored directly from your cloud provider of choice. This ability provides increased redundancy, better disaster recovery options, and benefits in both performance and cost savings.
  • New Backup Wizard: ClusterControl 1.5 comes with a complete redesign of our backup wizard. The wizard lets you perform and schedule backups using a variety of options and technologies to ensure your data is protected, accurate and ready to be restored on a moment's notice.
  • Single Database Backup & Restores for MySQL: With ClusterControl 1.5 you now have the ability to backup and restore individual MySQL databases rather than being forced to do it all at one time. This new feature can reduce the burden on those users who manage hundreds of databases within their environment.
  • Automatic Backup Verification: ClusterControl 1.5 brings you peace of mind by automatically verifying the integrity of your backup data. It will perform a restore of your backup data, and alert in case of issues.
  • Creating & Restoring Slaves from Backup: In the past a user would need to leverage their Master to create or restore new slaves… this creates an undue burden on the system as it performs a full backup on the master. In ClusterControl 1.5, you can now create new nodes or rebuild existing slaves from existing backup files, removing the burden on the master and ensuring you continue to operate at peak performance.

Improved Support for PostgreSQL

ClusterControl continues to expand its support for PostgreSQL. In our new 1.5 release, we can now support PostgreSQL 10 which offers a number of new features such as support for local replication, declarative table partitioning, improved query parallelism, quorum commit for synchronous replication, and more!

  • PostgreSQL Proxy and Virtual IP: ClusterControl now supports failover of database connections with HAProxy, Keepalived and Virtual IP - a battle-tested combination.
  • PostgreSQL Synchronous Replication Failover: ClusterControl 1.5 now fully supports Synchronous Replication Failover for PostgreSQL. This function minimizes the risk of data loss between Master and Slaves should something break with the Master before it has a chance to fully synchronize. This allows you to increase reliability across your servers.
  • New Backup Method: PostgreSQL has an additional backup method pg_basebackup that can be used for online binary backups. Backups taken with pg_basebackup can be used later for point-in-time recovery and as the starting point for a log shipping or streaming replication standby servers.

Improved Support for ProxySQL

ProxySQL enables MySQL, MariaDB and Percona XtraDB database systems to easily manage intense, high-traffic database applications without losing availability.

  • Script Scheduling: ClusterControl now provides support for the ProxySQL scheduler, a cron-like module which allows the load balancer to start external scripts on a regular interval. This provides users with full control of what scripts run and when, allowing you to tweak your instances performance at a very granular level.
  • User Management: Rather than create or removing users one at a time from ProxySQL, ClusterControl now allows you to import a large batch of users.

Support for New Versions of MariaDB & MySQL NDB Cluster

  • MariaDB 10.2: ClusterControl now supports MariaDB Server 10.2. This new version provides even greater integration with Galera Cluster, MariaDB’s HA solution of choice, and also features enhancements to SQL like windows functions, common table expressions, and JSON functions.
  • MySQL NDB Cluster 7.5: ClusterControl now supports MySQL Cluster (NDB) 7.5. The latest MySQL Cluster release using the NDB file system offers a variety of improvements and optimizations. These improvements include enhancing the ndbinfo database, records-per-key optimization, and many more!

Additional New Functionalities

  • New Notification Emails: In the 1.5 release of ClusterControl, we have revamped the design of the email notifications and alerts which are sent from the system to make them easier to read and understand.
  • New Operational Report: ClusterControl 1.5 introduces a new operational report called “Database Growth.” The report shows a snapshot of your database as it exists today as well as data for the last day, last week, and last month - useful for capacity planning. The report also allows you to click into each period to deep dive into the tables to track growth at an even more granular level.

ClusterControl 1.5 - PostgreSQL Load Balancing & ProxySQL Enhancements

$
0
0

Load balancers are an essential component in database high availability; especially when making topology changes transparent to applications and implementing read-write split functionality. ClusterControl provides an array of features to securely deploy, monitor and configure the industry's leading open source load balancing technologies.

In the past year we have added support for ProxySQL and added multiple enhancements for HAProxy and MariaDB’s Maxscale. We continue this tradition with the latest release of ClusterControl 1.5.

Based on feedback we received from our users, we have improved how ProxySQL is managed. We also added support for HAProxy and Keepalived to run on top of PostgreSQL clusters.

In this blog post, we’ll have a look at these improvements...

ProxySQL - User Management Enhancements

Previously, the UI would only allow you to create a new user or add an existing one, one at a time. One feedback we got from our users was that it is quite hard to manage a large number of users. We listened and in ClusterControl 1.5, it is now possible to import large batches of users. Let’s take a look at how you can do that. First of all, you need to have your ProxySQL deployed. Then, go to the ProxySQL node, and in the Users tab, you should see an “Import Users” button.

Once you click on it, a new dialog box will open:

Here you can see all of the users that ClusterControl detected on your cluster. You can scroll through them and pick the ones you want to import. You can also select or deselect all of the users from a current view.

Once you start to type in the Search box, ClusterControl will filter out non-matching results, narrowing the list only to users relevant to your search.

You can use the “Select All” button to select all users which match your search. Of course, after you selected users you want to import, you can clear the search box and start another search:

Please note “(7 selected)” - it tells you how many users, in total (not just from this search), you have selected to import. You can also click on it to see only the users you selected to import.

Once you are happy with your choice, you can click “Next” to go to the next screen.

Here you need to decide what should be the default hostgroup for each user. You can do that on per-user basis or globally, for the whole set or a subset of users resulting from a search.

Once you click on the “Import Users” button, users will be imported and they will show up in the Users tab.

ProxySQL - Scheduler Management

ProxySQL’s scheduler is a cron-like module which allows ProxySQL to start external scripts on a regular interval. The schedule can be quite granular - up to one execution every millisecond. Typically, the scheduler is used to execute Galera checker scripts (like proxysql_galera_checker.sh), but it can also be used to execute any other script that you like. In the past, ClusterControl used the scheduler to deploy the Galera checker script but this was not exposed in the UI. Starting ClusterControl 1.5, you now have full control.

As you can see, one script has been scheduled to run every 2 seconds (2000 milliseconds) - this is the default configuration for Galera cluster.

The above screenshot shows us options for editing existing entries. Please note that ProxySQL supports up to 5 arguments to the scripts it’ll execute through the scheduler.

If you want a new script to be added to the scheduler, you can click on the “Add New Script” button and you will be presented with a screen like the above. You can also preview how the full script will look like when executed. After you have filled all “Argument” fields and defined the interval, you can click on “Add New Script” button.

As a result, a script will be added to the scheduler and it’ll be visible on the list of scheduled scripts.

ClusterControl
Single Console for Your Entire Database Infrastructure
Find out what else is new in ClusterControl

PostgreSQL - Building the High Availability Stack

Setting up replication with auto failover is good, but applications need a simple way to track the writeable master. So we added support for HAProxy and Keepalived on top of the PostgreSQL clusters. This allows our PostgreSQL users to deploy a full high availability stack using ClusterControl.

From the Load Balancer sub tab, you can now deploy HAProxy - if you are familiar with how ClusterControl deploys MySQL replication, it is a very similiar setup. We install HAProxy on a given host, two backends, reads on port 3308 and writes on port 3307. It uses tcp-check, expecting a particular string to return. To produce that string, the following steps are executed on all of the database nodes. First of all, xinet.d is configured to run a service on port 9201 (to avoid confusion with MySQL setup, which uses port 9200).

# default: on
# description: postgreschk
service postgreschk
{
        flags           = REUSE
        socket_type     = stream
        port            = 9201
        wait            = no
        user            = root
        server          = /usr/local/sbin/postgreschk
        log_on_failure  += USERID
        disable         = no
        #only_from       = 0.0.0.0/0
        only_from       = 0.0.0.0/0
        per_source      = UNLIMITED

The service executes /usr/local/sbin/postgreschk script, which validates the state of PostgreSQL and tells if a given host is available and what type of host it is (master or slave). If everything is ok, it returns the string expected by HAProxy.

Just like with MySQL, HAProxy nodes in PostgreSQL clusters are seen in the UI and the status page can be accessed:

Here you can see both backends and verify that only the master is up for the r/w backend and all nodes can be accessed through the read-only backend. You can also get some statistics about traffic and connections.

HAProxy helps to improve high availability, but it can become a single point of failure. We need to go the extra mile and configure redundancy with the help of Keepalived.

Under Manage -> Load balancer -> Keepalived, you pick the HAProxy hosts you’d like to use and Keepalived will be deployed on top of them with a Virtual IP attached to the interface of your choice.

From now on, all connectivity should go to the VIP, which will be attached to one of the HAProxy nodes. If that node goes down, Keepalived will take the VIP down on that node and bring it up on another HAProxy node.

That’s it for the load balancing features introduced in ClusterControl 1.5. Do try them and let us know how yo

Deploying MySQL, MariaDB, Percona Server, MongoDB or PostgreSQL - Made Easy with ClusterControl

$
0
0

Helping users securely automate and manage their open source databases has been at the core of our efforts from the inception of Severalnines.

And ever since the first release of our flagship product, ClusterControl, it’s always been about making it as easy and secure as possible for users to deploy complex, open source database cluster technologies in any environment.

Since our first steps with deployment, automation and management we’ve perfected the art of securely deploying highly available open source database infrastructures by developing ClusterControl from a deployment and monitoring tool to a full-blown automation and management system adopted by thousands of users worldwide.

As a result, ClusterControl can be used today to deploy, monitor, and manage over a dozen versions of the most popular open source database technologies - on premise or in the cloud.

Whether you’re looking to deploy MySQL standalone, MySQL replication, MySQL Cluster, Galera Cluster, MariaDB, MariaDB Cluster, Percona XtraDB and Percona Server for MongoDB, MongoDB itself and PostgreSQL - ClusterControl has you covered.

In addition to the database stores, users can also deploy and manage load balancing technologies such as HAProxy, ProxySQL, MaxScale and Keepalived.

“Very easy to deploy a cluster, also it facilitates administration and monitoring.”

Michel Berger IT Applications Manager European Broadcasting Union (EBU)

Using ClusterControl, database clusters can be either deployed new or existing ones imported.

A deployment wizard makes it easy and secure to deploy production-ready database clusters with a point and click interface that walks the users through the deployment process step by step.

Select Deploy or Import Cluster

ClusterControl
Single Console for Your Entire Database Infrastructure
Find out what else is new in ClusterControl

Walk through of the Deploy Wizard

View your cluster list

“ClusterControl is great for deploying and managing a high availability infrastructure. Also find the interface very easy to manage.”

Paul Masterson, Infrastructure Architect, Dunnes

Deploying with the ClusterControl CLI

Users can also chose to work with our CLI, which allows for easy integration with infrastructure orchestration tools such as Ansible etc.

s9s cluster
  --create
  --cluster-type=galera
  --nodes='10.10.10.26;10.10.10.27;10.10.10.28'
  --vendor=percona
  --cluster-name=PXC_CENTOS7
  --provider-version=5.7
  --os-user=vagrant   --wait

The ClusterControl deployment supports multiple NICS and templated configurations.

In short, ClusterControl provides:

  • Topology-aware deployment jobs for MySQL, MariaDB,Percona, MongoDB and PostgreSQL
  • Self-service and on-demand
  • From standalone nodes to load-balanced clusters
  • Your choice of barebone servers, private/public cloud and containers

To see for yourself, download ClusterControl today and give us your feedback.

Become a PostgreSQL DBA: Point-in-Time Database Restoration

$
0
0

The ability to perform backup and restore of your data is one of the fundamental requirements of any DBMS. In a previous post, we discussed Postgres backups in general. In this blog post, we’ll look at how to do point-in-time recovery for PostgreSQL.

Point-in-time recovery (PITR) is a pretty useful feature. You need to keep in mind that the backup is a “snapshot” of your dataset at a given point of time. If you take backups on a daily basis, in the worst case scenario, you will have almost 24 hours of data that is not in more than you had in your last backup. So restoring from the last backup means losing a day’s worth of data. In general, it’s not really ok to lose so much data. Therefore you need to think about how you can recover all the changes that happened since you took the last backup. Let’s see how the whole process of backing up data and restoring it after an incident may look like on PostgreSQL 10.1 (which you can deploy using ClusterControl).

Setting up WAL archiving

PostgreSQL stores all modifications in form of Write-Ahead Logs (WAL). These files can be used for replication, but they can also be used for PITR. First of all, we need to setup WAL archiving. We’ll start with creating a directory in which the WAL files will be stored. This can be in any location: on disk, on NFS mount, anywhere - as long as PostgreSQL can write to it, it’ll do.

mkdir /wal_archive
chown -R postgres.postgres /wal_archive

We’ll create a simple directory and make sure it’s owned by ‘postgres’ user. Once this is done, we can start editing the PostgreSQL configuration.

archive_mode = on                       # enables archiving; off, on, or always
                                # (change requires restart)
archive_command = 'test ! -f /wal_archive/%f && cp %p /wal_archive/%f'                          # command to use to archive a logfile segment

wal_level = archive     # minimal, replica, or logical

The settings above have to be configured - you want to enable archiving (archive_mode = on), you want also to set wal_lever to archive. Archive_command requires more explanation. PostgreSQL doesn’t care where you will put the files, as long as you’ll tell it how to do it. This command will be used to copy the files to their destination. It can be a simple one-liner, as in the example above, it can be a call to a complex script or binary. What’s important is that this command should not overwrite existing files. It also should return zero exit status only when it managed to copy the file. If the return code will be different than 0, PostgreSQL will attempt to copy that file again. In our case, we verify if the file already exists or not. If not, we will copy it to the destination. ‘%p’ represents full path to the WAL file to be copied while ‘%f’ represents the filename only.

Once we are done with those changes, we need to restart PostgreSQL:

service postgresql restart

At this point, you should see WAL files appearing in your target directory. Please keep in mind that the process is triggered after a WAL file rotation - if you have very low traffic, it may take a while before WAL archiving will be started.

Base backup

The next step will be to take a base backup that we’ll use as a base for our point-in-time restore. You can take it using pg_basebackup:

pg_basebackup -Umyuser -h127.0.0.1 --progress -D /basebackup/

Or you can use ClusterControl for that:

When dealing with it manually, you may need to edit your pg_hba.conf to allow replication connections for the user you’ll be using for pg_basebackup. ClusterControl will take care of it for you.

Restore

Once you have a base backup done and WAL archiving configured, you are good to go. First of all, you need to figure out the point at which you should restore your data. Ideally, you’ll be able to give an exact time. Other options are: a named restore point (pg_create_restore_point()), transaction ID or WAL location LSN. You can try to use the pg_waldump utility to parse WAL files and print them in human-readable format, but it’s actually far from being human-readable so it can still be tricky to pinpoint the exact location.

rmgr: Transaction len (rec/tot):     34/    34, tx:     801534, lsn: 3/726587F0, prev 3/726587A8, desc: COMMIT 2017-11-30 12:39:05.086674 UTC
rmgr: Standby     len (rec/tot):     42/    42, tx:     801535, lsn: 3/72658818, prev 3/726587F0, desc: LOCK xid 801535 db 12938 rel 16450
rmgr: Storage     len (rec/tot):     42/    42, tx:     801535, lsn: 3/72658848, prev 3/72658818, desc: CREATE base/12938/16456
rmgr: Heap        len (rec/tot):    123/   123, tx:     801535, lsn: 3/72658878, prev 3/72658848, desc: UPDATE off 7 xmax 801535 ; new off 9 xmax 0, blkref #0: rel 1663/12938/1259 blk 0

When you know at which point you need to restore to, you can proceed with the recovery. First, you should stop the PostgreSQL server:

service postgresql stop

Then you need to remove all of the data directory, restore the base backup and then remove any existing WAL files. PostgreSQL will copy the data from our WAL archive directory.

rm -rf /var/lib/postgresql/10/main/*
cp -r /basebackup/* /var/lib/postgresql/10/main/
rm -rf /var/lib/postgresql/10/main/pg_wal/*

Now, it’s time to prepare the recovery.conf file, which will define how the recovery process will look like.

vim /var/lib/postgresql/10/main/recovery.conf
restore_command = 'cp /wal_archive/%f "%p"'
recovery_target_lsn = '3/72658818'

In the example above, we defined a restore command (simple cp from our /wal_archive directory into PostgreSQL pg_wal directory). We also should decide where to stop - we decided to use a particular LSN as a stop point, but you can also use:

recovery_target_name
recovery_target_time
recovery_target_xid

for a named restore point, timestamp and transaction ID.

Finally, make sure that all of the files in the PostgreSQL data directory have the correct owner:

chown -R postgres.postgres /var/lib/postgresql/

Once this is done, we can start PostgreSQL:

service postgresql start

In the log you should see entries like this:

2017-12-01 10:45:56.362 UTC [8576] LOG:  restored log file "000000010000000300000034" from archive
2017-12-01 10:45:56.401 UTC [8576] LOG:  restored log file "00000001000000030000001D" from archive
2017-12-01 10:45:56.419 UTC [8576] LOG:  redo starts at 3/1D9D5408
2017-12-01 10:45:56.464 UTC [8576] LOG:  restored log file "00000001000000030000001E" from archive
2017-12-01 10:45:56.526 UTC [8576] LOG:  restored log file "00000001000000030000001F" from archive
2017-12-01 10:45:56.583 UTC [8576] LOG:  restored log file "000000010000000300000020" from archive
2017-12-01 10:45:56.639 UTC [8576] LOG:  restored log file "000000010000000300000021" from archive
2017-12-01 10:45:56.695 UTC [8576] LOG:  restored log file "000000010000000300000022" from archive
2017-12-01 10:45:56.753 UTC [8576] LOG:  restored log file "000000010000000300000023" from archive
2017-12-01 10:45:56.812 UTC [8576] LOG:  restored log file "000000010000000300000024" from archive
2017-12-01 10:45:56.870 UTC [8576] LOG:  restored log file "000000010000000300000025" from archive

Once done, the server will still be in recovery mode. You can switch it to normal operations by running:

postgres=# create database mydb;
ERROR:  cannot execute CREATE DATABASE in a read-only transaction
postgres=# SELECT pg_wal_replay_resume();
 pg_wal_replay_resume
----------------------

(1 row)

postgres=# create database mydb;
CREATE DATABASE

You can also define in recovery.conf how PostgreSQL should behave after the recovery using:

recovery_target_action

There are three options:

  • ‘pause’, the default, keeps the server in recovery mode. It is useful if you want to verify that everything is indeed in place before you allow normal traffic to hit the server and modify data.
  • ‘promote’ will end the recovery mode as soon as the recovery itself completes.
  • ‘shutdown’ will stop the PostgreSQL server after the recovery.

After recovery is complete, recovery.conf file will be renamed to recovery.done. Please keep in mind that this won’t happen with:

recovery_target_action = ‘shutdown’

In this case you need to remove or rename the file manually, otherwise the server will keep restarting over and over again.

As you can see, there is good support for performing point in time recovery in PostgreSQL. We hope you that you won’t have to go through this process on your production servers. It’s still good practice to test your organization’s skills in performing point-in-time recovery every now and then, so you are prepared in case of emergency.

ClusterControl - All the Feature Highlights & Improvements from 2017

$
0
0

With four major releases in 2017 ClusterControl is better than ever at supporting your MySQL, MariaDB, MongoDB& PostgreSQL environments.

When thinking about the features and functions released in 2017 three main themes emerge…

Delivering High Availability

2017 meant the introduction of ProxySQL, a lightweight yet complex protocol-aware proxy that sits between the MySQL clients and server. It also meant improved support for HAProxy and Keepalived and making sure that MySQL and MariaDB can fully utilize them.

Making You More Efficient

From the introduction of the new ClusterControl CLI to dozens of improvements to our UI to the new system to integration with alarms and chatops, ClusterControl now makes it even easier to manage your database environments.

Mixed Environment Support

ClusterControl has always been the system to manage multiple technologies from a single console and have them work together seamlessly. 2017 meant adding support for the latest versions of MariaDB, MongoDB, MySQL, PostgreSQL, Percona Server, and Galera Cluster.

ClusterControl 1.4.0 - January 2017

Announced in January 2017, ClusterControl version 1.4.0 brought several improvements for MySQL Replication and MongoDB. It was also the first version to introduce features for ProxySQL.

With the new version you are now able to deploy a multi-master replication setup in active - standby mode. One master will actively take writes, while the other one is ready to take over writes should the active master fail. From the UI, you can also easily add slaves under each master and reconfigure the topology by promoting new masters and failing over slaves.

Topology reconfigurations and master failovers are not always possible in case of replication problems, for instance errant transactions. In this version ClusterControl checks for issues before any failover or switchover happens. The admin can define whitelists and blacklists of which slaves to promote to master (and vice versa). This makes it easier for admins to customize failover automation in their replication setups.

For MongoDB we extended support, bringing sharded clusters in addition to replica sets. Coupled with this is the ability to retrieve more metrics for monitoring, adding new advisors and providing consistent backups for sharding. With this release, you could now convert a ReplicaSet cluster to a sharded cluster, add or remove shards from a sharded cluster as well as add Mongos/routers to a sharded cluster.

Lastly, we added our initial support for ProxySQL allowing for its deployment onto MySQL Replication setups.

ClusterControl 1.4.1 - April 2017

April was ProxySQL month at Severalnines. ClusterControl 1.4.1 focused almost exclusively on adding additional features and support for this exciting new load balancing technology.

In this version you could now easily configure and manage your ProxySQL deployments with a comprehensive UI. You could create servers, reorientate your setup, create users, set rules, manage query routing, and enable variable configurations. It was now possible to view query analytics for all queries going through the proxy, and e.g. cache any frequent queries in just a click.

ClusterControl 1.4.2 - June 2017

Coined “The DevOps Edition”, version 1.4.2 brought improved support and new features like automated failover for PostgreSQL& MongoDB and included even more features for ProxySQL.

One of the main highlights in this release is the ClusterControl CLI, which allows users who prefer to manage their databases through the command line. All actions, such as deploying a cluster, using the CLI will be visible in the UI and vice versa.

Also included in this release is the new integration system for alarm notification and chatops systems. This new integration with popular incident management and chat services lets you customise the alarms and get alerted in the ops tools you are already using - e.g., Pagerduty, VictorOps, Telegram, Opsgenie and Slack.

ClusterControl 1.5.0 - November 2017

ClusterControl 1.5 provided an array of exciting new backup functionalities to ensure that your data is secure and available whenever disaster strikes. The release also provides expanded PostgreSQL, MariaDB, MySQL NDB Cluster, and ProxySQL support.

This version introduced a new Backup Wizard with new support for AWS & Google Cloud backups, backup verification, Single Database backups and restores, and the ability to create and restore slaves from a backup rather than doing it from the master. Automatic restore testing was an awaited feature, as it is a time consuming task that is often neglected by database administrators.

PostgreSQL got a number of new features in this version including version 10 support, load balancing and virtual IP support with HAProxy and Keepalived, a new backup method, and support for synchronous replication failover.

The version also included support for MariaDB 10.2 and MySQL NDB Cluster 7.5.

ClusterControl
Single Console for Your Entire Database Infrastructure
Find out what else is new in ClusterControl

If any of these features appeal to you make sure to upgrade or download the latest version of ClusterControl to take advantage of them.

We look forward to providing you even more features to help you deploy, monitor, manage and scale your open source databases further in 2018!


Performing Replication Topology Changes for PostgreSQL

$
0
0

Replication plays a crucial role in maintaining high availability. Servers can fail, the operating system or the database software might need to be upgraded. This means reshuffling server roles and moving replication links, while maintaining data consistency across all databases. Topology changes will be required, and there are different ways to perform them.

Promoting a standby server

Arguably, this is the most common operation that you will need to perform. There are multiple reasons - for instance, database maintenance on the primary server that would impact the workload in an unacceptable manner. There could be planned downtime due to some hardware operations. The crash of the primary server which renders it unaccessible to the application. These are all reasons to perform a failover, whether planned or not. In all cases you will have to promote one of the standby servers to become a new primary server.

To promote a standby server, you need to run:

postgres@vagrant-ubuntu-trusty-64:~$ /usr/lib/postgresql/10/bin/pg_ctl promote -D /var/lib/postgresql/10/main/
waiting for server to promote.... done
server promoted

It is easy to run this command, but first, make sure  to avoid any loss of data. If we are talking about a “primary server down” scenario, you may not have too many options. If it is a planned maintenance, then it is possible to prepare for it. You need to stop the traffic on the primary server, and then verify that the standby server received and applied all of the data. This can be done on the standby server, using query as below:

postgres=# select pg_last_wal_receive_lsn(), pg_last_wal_replay_lsn();
 pg_last_wal_receive_lsn | pg_last_wal_replay_lsn
-------------------------+------------------------
 1/AA2D2B08              | 1/AA2D2B08
(1 row)

Once all is good, you can stop the old primary server and promote the standby server.

Reslaving a standby server off a new primary server

You may have more than one standby server slaving off your primary server. After all, standby servers are useful to offload read-only traffic. After promoting a standby server to a new primary server, you need to do something about the remaining standby servers which are still connected (or which are trying to connect) to the old primary server. Unfortunately, you cannot just change the recovery.conf and connect them to the new primary server. To connect them, you first need to rebuild them. There are two methods you can try here: standard base backup or pg_rewind.

We won’t get into details how to take a base backup - we covered it in our previous blog post, which focussed on taking backups and restoring them on PostgreSQL. If you happen to use ClusterControl, you can also use it to create a base backup:

On the other hand, let’s say couple of words about pg_rewind. The main difference between both methods is that base backup creates a full copy of the data set. If we are talking about small datasets, it can be ok but for datasets with hundreds of gigabytes in size (or even larger), it can quickly become a problem. In the end, you want to have your standby servers quickly up and running - to offload your active server and to have another standby to failover to, should the need arise. Pg_rewind works differently - it copies only those blocks which have been modified. Instead of copying everything, it copies changes only, speeding up the process quite significantly. Let’s assume your new master has an IP of 10.0.0.103. This is how you can execute pg_rewind. Please note that you have to have the target server stopped - PostgreSQL can’t be running there.

postgres@vagrant-ubuntu-trusty-64:~$ /usr/lib/postgresql/10/bin/pg_rewind --source-server="user=myuser dbname=postgres host=10.0.0.103" --target-pgdata=/var/lib/postgresql/10/main --dry-run
servers diverged at WAL location 1/AA4F1160 on timeline 3
rewinding from last common checkpoint at 1/AA4F10F0 on timeline 3
Done!

This will make a dry run, testing the process but not making any changes. If everything is fine, all you’ll have to do will be to run it again, this time without the ‘--dry-run’ parameter. Once it’s done, the last remaining step will be to create a recovery.conf file, which will point to the new master. It may look like this:

standby_mode = 'on'
primary_conninfo = 'application_name=pgsql_node_0 host=10.0.0.103 port=5432 user=replication_user password=replication_password'
recovery_target_timeline = 'latest'
trigger_file = '/tmp/failover.trigger'

Now you are ready to start your standby server and it will replicate off the new active server.

Chained replication

There are numerous reasons why you might want to build a chained replication, although it is typically done to reduce the load on the primary server. Serving the WAL to standby servers adds some overhead. It’s not much of a problem if you have a standby or two, but if we are talking about large number of standby servers, this can become an issue. For example, we can minimize the number of standby servers replicating directly from the active by creating a topology as below:

The move from a topology of two standby servers to a chained replication is fairly straightforward.

You would need to modify recovery.conf on 10.0.0.103, point it towards the 10.0.0.102 and then restart PostgreSQL.

standby_mode = 'on'
primary_conninfo = 'application_name=pgsql_node_0 host=10.0.0.102 port=5432 user=replication_user password=replication_password'
recovery_target_timeline = 'latest'
trigger_file = '/tmp/failover.trigger'

After restart, 10.0.0.103 should start to apply WAL updates.

These are some common cases of topology changes. One topic that was not discussed, but which is still important, is the impact of these changes on the applications. We’ll cover that in a separate post, as well as how to make these topology changes transparent to the applications.

Open Source Databases in 2017 and Trends for 2018

$
0
0

With 2017 quickly coming to a close and 2018 looming on the horizon we wanted to take a minute and reflect on what’s been happening in our industry in the past year and what we are excited about for the future.

Johan Andersson, Severalnines CTO and Co-Founder took a few minutes from working on the newest releases of ClusterControl to talk with us about his thoughts on 2017.

2018 Database Trends and Predictions

As technology moves fast the open source world moves even faster. Here are some predictions from around the web for 2018…

FORBES

  • “In 2017, DevOps suffered from under-budgeting and a perception from management that things that were inexpensive as tools were mostly open source. However, non-standardized adoption and expensive DevOps resources skewed budget. With the realization that open source doesn’t equal free, especially as enterprise-grade support is required, there will be increased awareness of the budget needed for skilled DevOps resources. This barrier should get lowered -- organizations will need a budget for experimentation and failure.”

GITHUB

  • “Data will rule all. Over the last several years, Cloud 1.0 has been about computing in big clouds, while Cloud 2.0 is all about data. This includes data movement and the tools and services that support it, like analytics and machine learning systems. Today all companies are data companies, whether they know it or not. In 2018, so long as teams know how to use it, data will become their greatest asset.”
  • “A decade ago, Linux was a big deal. Now it’s standard. Back in the day, companies like Amazon, Google, and Microsoft were forced to build their own, proprietary tools because no other software existed to meet their needs. Many of these frameworks have since been open sourced—and other open source technologies, like Kubernetes, are becoming integral to developers' workflows. This shift is changing what companies are investing in, making open source software traditional software's biggest competitor.”

OPENSOURCE.COM

  • “Containers gain even more acceptance. Container technology is the approach of packaging pieces of code in a standardized way so they can be "plugged and run" quickly in any environment. Container technology allows enterprises to cut costs and implementation times. While the potential of containers to revolutionize IT infrastructure has been evident for a while, actual container use has remained complex. Container technology is still evolving, and the complexities associated with the technology decrease with every advancement. The latest developments make containers quite intuitive and as easy as using a smartphone, not to mention tuned for today's needs, where speed and agility can make or break a business.”

DBTA.COM

  • “Rapid Kubernetes adoption forms the foundation for multi-cloud deployments:We predict runaway success of Kubernetes, but it is running away with the prize of adoption so fast that this may quickly be more of an observation than a prediction in 2018. So far, however, almost everybody is thinking of Kubernetes as a way of organizing and orchestrating computation in a cloud. Over the next year, we expect Kubernetes to more and more be the way that leading-edge companies organize and orchestrate computation across multiple clouds, both public and private. On premises computation is moving to containers and orchestration style at light speed, but when you can interchangeably schedule work anywhere that it makes sense to do so, you will see the real revolution.”
  • “Fear of cloud lock-in will result in cloud sprawl: As CIOs try to diversify investment in their compute providers, inclusive of their own on-premise capabilities, the diversification will result in data, services and algorithms spreading across multiple clouds. Finding information or code within a single cloud is tough enough. The data silos built from multiple clouds will be deep and far apart, pushing the cost of management onto humans that need to understand the infrastructure.”
ClusterControl
Single Console for Your Entire Database Infrastructure
Find out what else is new in ClusterControl

Severalnines 2018 Predictions

Several members of our team took a moment to share their thoughts on 2018 and the future of the open source database world…

Vinay Joosery, CEO & Co-Founder

  • Databases in Containers: I think a lot of people have gone from discussing the pros and cons of Docker for databases, and whether it is a good idea at all when it comes to running databases on Docker, to trying it not only in test/dev, but in actual live production!

Alex Yu, VP of Products

  • Cloud and containerized services as the new norm - More companies will start new projects in the cloud with multiple providers and applications will be written with cloud-native architectures in mind.
  • Traditional monolithic applications will continue to give away to more loosely coupled services which are easier to build, deploy, update, scale or move to other cloud and container service providers. Cloud-native services are resilient by nature and will facilitate faster development cycles and feedback loops.
  • Container technologies such as Kubernetes and Docker are already de-facto standard for typical stateless applications/services using "application containers" however databases though are intrinsically stateful and we will hopefully see more use of "system containers" such as LXD coming into the mainstream and gain adoption.
  • This "new world" has an impact on database management and monitoring applications where containerized services come and go frequently. The lifetime of a host is many times longer than a container where the uptime can be measured in only minutes or hours. Host centric management and monitoring will give away to a cloud-native service oriented model where the transient nature is the norm.

Jean-Jérôme Schmidt, VP of Marketing

  • The European Union (EU) is the world’s 2nd largest economy after China and before the US. It’s about to enact a new piece of legislation with far-reaching consequences for anyone doing business involving its residents … and yet it seems to be going almost unnoticed. The European General Data Protection Regulation (GDPR) is due to come into effect in May 2018 and will impact anyone and any business or organisation that deals with and stores EU residents’ personal data in some form or shape. And it will make the organisations that are handling that data responsible for any breaches or misuse. It will therefore be of the highest importance how data is collected, processed and secured. In other words, databases and their infrastructures will be in the spotlight more than ever before and how these database are automated and managed will be crucial for anyone doing business with or within the EU. The GDPR is probably not getting the attention it should because the perception that’s being maintained globally is that the US (and maybe China) are the only large-scale economies worth being concerned with, but the reality is that the EU is the one to be focussed on, particularly next year. So if you’re not sure whether you have your databases and their EU residents data 99.999% under control … contact us ;-)

Ashraf Sharif, Senior Support Engineer

  • We are expecting higher adoption of MySQL 8.0 once it becomes GA. It introduces many notable enhancements like transactional data dictionary, atomic DDL, invisible indexes, common table expression (CTE), windows function and MySQL roles to name some of them. More details at MySQL Documentation page. We are also forecasting a growth in MyRocks storage engine adoption which is already included in Percona Server 5.7 and MariaDB 10.2.
  • MySQL on Docker will be getting much more attention in the coming years, after a number of success stories like Uber and BlablaCar. We've seen many people trying to adapt this technology as a reliable backend data service with the help of in-house automation scripts and Docker orchestration tools. Besides, Docker has announced support for Kubernetes, allowing developers and operators to build apps with Docker and seamlessly test and deploy them using both Docker Swarm and Kubernetes.

Krzysztof Książek, Senior Support Engineer

  • The main new trend that I see today is a move towards column store, analytics databases. MariaDB has it as part of their offering and ClickHouse seems to get traction as a go-to analytics Database engine that works alongside MySQL. ProxySQL's support for ClickHouse also makes it easier for the application to connect to either MySQL or ClickHouse, whatever is needed at that moment. If your dataset is small, you can do analytics in MySQL but there are other tools which do it better - faster and use less disk to store the data.

PostgreSQL Load Balancing Using HAProxy & Keepalived

$
0
0

A proxy layer can be quite useful in increasing availability of your database tier. It may reduce the amount of code on the application side to handle database failures and replication topology changes. In this blog post we will discuss how to setup a HAProxy to work on top of PostgreSQL.

First things first - HAProxy works with databases as a network layer proxy. There is no understanding of the underlying, sometimes complex, topology. All HAProxy does is to send packets in round-robin fashion to defined backends. It does not inspect packets nor it understands protocol in which applications talk with PostgreSQL. As a result, there’s no way for the HAProxy to implement read/write split on a single port - it would require parsing of queries. As long as your application can split reads from writes and send them to different IPs or ports, you can implement R/W split using two backends. Let’s take a look at how it can be done.

HAProxy Configuration

Below you can find an example of two PostgreSQL backends configured in HAProxy.

listen  haproxy_10.0.0.101_3307_rw
        bind *:3307
        mode tcp
        timeout client  10800s
        timeout server  10800s
        tcp-check expect string master\ is\ running
        balance leastconn
        option tcp-check
        option allbackups
        default-server port 9201 inter 2s downinter 5s rise 3 fall 2 slowstart 60s maxconn 64 maxqueue 128 weight 100
        server 10.0.0.101 10.0.0.101:5432 check
        server 10.0.0.102 10.0.0.102:5432 check
        server 10.0.0.103 10.0.0.103:5432 check


listen  haproxy_10.0.0.101_3308_ro
        bind *:3308
        mode tcp
        timeout client  10800s
        timeout server  10800s
        tcp-check expect string is\ running.
        balance leastconn
        option tcp-check
        option allbackups
        default-server port 9201 inter 2s downinter 5s rise 3 fall 2 slowstart 60s maxconn 64 maxqueue 128 weight 100
        server 10.0.0.101 10.0.0.101:5432 check
        server 10.0.0.102 10.0.0.102:5432 check
        server 10.0.0.103 10.0.0.103:5432 check

As we can see, they use ports 3307 for writes and 3308 for reads. In this setup there are three servers - one active and two standby replicas. What’s important, tcp-check is used to track the health of the nodes. HAProxy will connect to port 9201 and it expects to see a string returned. Healthy members of the backend will return expected content, those who will not return the string will be marked as unavailable.

Xinetd Setup

As HAProxy checks port 9201, something has to listen on it. We can use xinetd to listen there and run some scripts for us. Example configuration of such service may look like:

# default: on
# description: postgreschk
service postgreschk
{
        flags           = REUSE
        socket_type     = stream
        port            = 9201
        wait            = no
        user            = root
        server          = /usr/local/sbin/postgreschk
        log_on_failure  += USERID
        disable         = no
        #only_from       = 0.0.0.0/0
        only_from       = 0.0.0.0/0
        per_source      = UNLIMITED
}

You need to make sure you add the line:

postgreschk        9201/tcp

to the /etc/services.

Xinetd starts a postgreschk script, which has contents like below:

#!/bin/bash
#
# This script checks if a PostgreSQL server is healthy running on localhost. It will
# return:
# "HTTP/1.x 200 OK\r" (if postgres is running smoothly)
# - OR -
# "HTTP/1.x 500 Internal Server Error\r" (else)
#
# The purpose of this script is make haproxy capable of monitoring PostgreSQL properly
#

export PGHOST='10.0.0.101'
export PGUSER='someuser'
export PGPASSWORD='somepassword'
export PGPORT='5432'
export PGDATABASE='postgres'
export PGCONNECT_TIMEOUT=10

FORCE_FAIL="/dev/shm/proxyoff"

SLAVE_CHECK="SELECT pg_is_in_recovery()"
WRITABLE_CHECK="SHOW transaction_read_only"

return_ok()
{
    echo -e "HTTP/1.1 200 OK\r\n"
    echo -e "Content-Type: text/html\r\n"
    if [ "$1x" == "masterx" ]; then
        echo -e "Content-Length: 56\r\n"
        echo -e "\r\n"
        echo -e "<html><body>PostgreSQL master is running.</body></html>\r\n"
    elif [ "$1x" == "slavex" ]; then
        echo -e "Content-Length: 55\r\n"
        echo -e "\r\n"
        echo -e "<html><body>PostgreSQL slave is running.</body></html>\r\n"
    else
        echo -e "Content-Length: 49\r\n"
        echo -e "\r\n"
        echo -e "<html><body>PostgreSQL is running.</body></html>\r\n"
    fi
    echo -e "\r\n"

    unset PGUSER
    unset PGPASSWORD
    exit 0
}

return_fail()
{
    echo -e "HTTP/1.1 503 Service Unavailable\r\n"
    echo -e "Content-Type: text/html\r\n"
    echo -e "Content-Length: 48\r\n"
    echo -e "\r\n"
    echo -e "<html><body>PostgreSQL is *down*.</body></html>\r\n"
    echo -e "\r\n"

    unset PGUSER
    unset PGPASSWORD
    exit 1
}

if [ -f "$FORCE_FAIL" ]; then
    return_fail;
fi

# check if in recovery mode (that means it is a 'slave')
SLAVE=$(psql -qt -c "$SLAVE_CHECK" 2>/dev/null)
if [ $? -ne 0 ]; then
    return_fail;
elif echo $SLAVE | egrep -i "(t|true|on|1)" 2>/dev/null >/dev/null; then
    return_ok "slave"
fi

# check if writable (then we consider it as a 'master')
READONLY=$(psql -qt -c "$WRITABLE_CHECK" 2>/dev/null)
if [ $? -ne 0 ]; then
    return_fail;
elif echo $READONLY | egrep -i "(f|false|off|0)" 2>/dev/null >/dev/null; then
    return_ok "master"
fi

return_ok "none";

The logic of the script goes as follows. There are two queries which are used to detect the state of the node.

SLAVE_CHECK="SELECT pg_is_in_recovery()"
WRITABLE_CHECK="SHOW transaction_read_only"

The first checks if PostgreSQL is in recovery - it will be ‘false’ for the active server and ‘true’ for standby servers. The second checks if PostgreSQL is in read-only mode. The active server will return ‘off’ while standby servers will return ‘on’. Based on the results, the script calls the return_ok() function with a right parameter (‘master’ or ‘slave’, depending on what was detected). If the queries failed, a ‘return_fail’ function will be executed.

Return_ok function returns a string based on the argument which was passed to it. If the host is an active server, the script will return “PostgreSQL master is running”. If it is a standby, the returned string will be: “PostgreSQL slave is running”. If the state is not clear, it’ll return: “PostgreSQL is running”. This is where the loop ends. HAProxy checks the state by connecting to xinetd. The latter starts a script, which then returns a string that HAProxy parses.

As you may remember, HAProxy expects the following strings:

tcp-check expect string master\ is\ running

for the write backend and

tcp-check expect string is\ running.

for the read-only backend. This makes the active server the only host available in the write backend while on the read backend, both active and standby servers can be used.

PostgreSQL and HAProxy in ClusterControl

The setup above is not complex, but it does takes some time to set it up. ClusterControl can be used to set all of this up for you.

In the cluster job dropdown menu, you have an option to add a load balancer. Then an option to deploy HAProxy shows up. You need to fill in where you’d like to install it, and make some decisions: from the repositories that you have configured on the host or the latest version, compiled from the source code. You’ll also need to configure which nodes in the cluster you’d like to add to HAProxy.

Once the HAProxy instance is deployed, you can access some statistics in the “Nodes” tab:

As we can see, for the R/W backend, only one host (active server) is marked as up. For the read-only backend, all nodes are up.

ClusterControl
Single Console for Your Entire Database Infrastructure
Find out what else is new in ClusterControl

Keepalived

HAProxy will sit between your applications and database instances, so it will be playing a central role. It can unfortunately also become a single point of failure, should it fail, there will be no route to the databases. To avoid such a situation, you can deploy multiple HAProxy instances. But then the question is - how to decide to which proxy host to connect to. If you deployed HAProxy from ClusterControl, it’s as simple as running another “Add Load Balancer” job, this time deploying Keepalived.

As we can see in the screenshot above, you can pick up to three HAProxy hosts and Keepalived will be deployed on top of them, monitoring their state. A Virtual IP (VIP) will be assigned to one of them. Your application should use this VIP to connect to the database. If the “active” HAProxy will become unavailable, VIP will be moved to another host.

As we have seen, it’s quite easy to deploy a full high availability stack for PostgreSQL. Do give it a try and let us know if you have any feedback.

Our Most Popular Database Blog Posts in 2017

$
0
0

As we wrap up our last blog of 2017 we wanted to reflect on what content we have been creating that’s been resonating and generating the most interest with our readers. We will continue to deliver the best technical content we can for MySQL, Galera Cluster, PostgreSQL, MariaDB, and MongoDB in 2018.

Here is some of our most popular content from 2017…

Top Database Blogs for 2017

ClusterControl
Single Console for Your Entire Database Infrastructure
Find out what else is new in ClusterControl

Top Blogs by Technology

While MySQL and MySQL Galera Cluster dominate our most popular content we blog about a lot of different technologies and methodologies on the Severalnines blog. Here are some of the most popular blogs in 2017 for non-MySQL topics.

If there are some blog topics you would like us to cover in 2018 please list them in the comments below.

Announcing ClusterControl 1.5.1 - Featuring Backup Encryption for MySQL, MongoDB & PostgreSQL

$
0
0

What better way to start a new year than with a new product release?

Today we are excited to announce the 1.5.1 release of ClusterControl - the all-inclusive database management system that lets you easily deploy, monitor, manage and scale highly available open source databases - and load balancers - in any environment: on-premise or in the cloud.

ClusterControl 1.5.1 features encryption of backups for MySQL, MongoDB and PostgreSQL, a new topology viewer, support for MongoDB 3.4, several user experience improvements and more!

Feature Highlights

Full Backup and Restore Encryption for these supported backup methods

  • mysqldump, xtrabackup (MySQL)
  • pg_dump, pg_basebackup (PostgreSQL)
  • mongodump (MongoDB)

New Topology View (BETA) shows your replication topology (including load balancers) for your entire cluster to help you visualize your setup.

  • MySQL Replication Topology
  • MySQL Galera Topology

Improved MongoDB Support

  • Support for MongoDB v3.4
  • Fix to add back restore from backup
  • Multiple NICs support. Management/public IPs for monitoring connections and data/private IPs for replication traffic

Misc

Improved user experience featuring a new left-side navigation that includes:

  • Global settings breakout to make it easier to find settings related to a specific feature
  • Quick node actions that allow you to quickly perform actions on your node
ClusterControl
Single Console for Your Entire Database Infrastructure
Find out what else is new in ClusterControl

View Release Details and Resources

Improving Database Security: Backup & Restore Encryption

ClusterControl 1.5 introduces another step to ensuring your databases are kept secure and protected.

Backup & restore encryption means that backups are encrypted at rest using AES-256 CBC algorithm. An auto generated key will be stored in the cluster's configuration file under /etc/cmon.d. The backup files are transferred in encrypted format. Users can now secure their backups for offsite or cloud storage with the flip of a checkbox. This feature is available for select backup methods for MySQL, MongoDB & PostgreSQL.

New Topology View (beta)

This exciting new feature provides an “overhead” topology view of your entire cluster, including load balancers. While in beta, this feature currently supports MySQL Replication and Galera topologies. With this new feature, you can drag and drop to perform node actions. For example, you can drag a replication slave on top of a master node - which will prompt you to either rebuild the slave or change the replication master.

Improved User Experience

The new Left Side Navigation and the new quick actions and settings that accompany it mark the first major redesign to the ClusterControl interface in some time. ClusterControl offers a vast array of functionality, so much so that it can sometimes be overwhelming to the novice. This addition of the new navigation allows the user quick access to what they need on a regular basis and the new node quick actions lets users quickly run common commands and requests right from the navigation.

Download the new ClusterControl or request a demo.

How to Secure Your Open Source Databases with ClusterControl

$
0
0

Security is one of the most important aspects of running a database. Whether you are a developer or a DBA, if you are managing the database, it is your responsibility to safeguard your data and protect it from any kind of unauthorized access. The unfortunate fact is that many organizations do not protect their data, as we’ve seen from the new wave of MongoDB ransomware attacks in September 2017. We had earlier published a blog on how to secure MongoDB databases.

In this blog post, we’ll have a look into how to secure your databases using ClusterControl. All of the features described here are available in version 1.5.1 of ClusterControl (released on December 23, 2017). Please note that some features are only available for certain database types.

Backup Encryption

ClusterControl 1.5.1 introduced a new feature called backup encryption. All encrypted backups are marked with a lock icon next to it:

You can use this feature on all backup methods (mysqldump, xtrabackup, mongodump, pg_dump) supported by ClusterControl. To enable encryption, simply toggle on the "Enable Encryption" switch when scheduling or creating the backup. ClusterControl automatically generates a key to encrypt the backup. It uses AES-256 (CBC) encryption algorithm and performs the encryption on-the-fly on the target server. The following command shows an example of how ClusterControl performs a mysqldump backup:

$ mysqldump --defaults-file=/etc/my.cnf --flush-privileges --hex-blob --opt --no-create-info --no-data --triggers --routines --events --single-transaction --skip-comments --skip-lock-tables --skip-add-locks --databases db1 | gzip -6 -c | openssl enc -aes-256-cbc -pass file:/var/tmp/cmon-094508-e0bc6ad658e88d93.tmp | socat - TCP4:192.168.55.170:9999'

You would see the following error if you tried to decompress an encrypted backup without decrypting it first with the proper key:

$ gunzip mysqldump_2018-01-03_175727_data.sql.gz
gzip: mysqldump_2018-01-03_175727_data.sql.gz: not in gzip format

The key is stored inside the ClusterControl database, and can be retrieved from the cmon_backup.metadata file for a particular backup set. It will be used by ClusterControl when performing restoration. Encrypting backups is highly recommended, especially when you want to secure your backups offsite like archiving them in the cloud.

MySQL/PostgreSQL Client-Server Encryption

Apart from following the recommended security steps during deployment, you can increase the reliability of your database service by using client-server SSL encryption. Using ClusterControl, you can perform this operation with simple point and click:

You can then retrieve the generated keys and certificates directly from the ClusterControl host under /var/lib/cmon/ca path to establish secure connections with the database clients. All the keys and certificates can be managed directly under Key Management, as described further down.

Database Replication Encryption

Replication traffic within a Galera Cluster can be enabled with just one click. ClusterControl uses a 2048-bit default key and certificate generated on the ClusterControl node, which is transferred to all the Galera nodes:

A cluster restart is necessary. ClusterControl will perform a rolling restart operation, taking one node at a time. You will see a green lock icon next to the database server (Galera indicates Galera Replication encryption, while SSL indicates client-server encryption) in the Hosts grid of the Overview page once encryption is enabled:

All the keys and certificates can be managed directly under Key Management, as described further down.

ClusterControl
Single Console for Your Entire Database Infrastructure
Find out what else is new in ClusterControl

Key Management

All the generated keys and certificates can be managed directly from the ClusterControl UI. Key Management allows you to manage SSL certificates and keys that can be provisioned on your clusters:

If the certificate has expired, you can simply use the UI to generate a new certificate with proper key and Certificate Authority (CA), or import an existing key and certificate into ClusterControl host.

Security Advisors

Advisors are mini-programs that run in ClusterControl. They perform specific tasks and provide advice on how to address issues in areas such as performance, security, log management, configuration, storage space and others. Each advisor can be scheduled like a cron job, and run as a standalone executable within the ClusterControl UI. It can also be run via the ClusterControl 's9s' command line client.

ClusterControl enables two security advisors for MySQL-based systems:

  • Access from any host ('%') - Identifies all users that use a wildcard host from the mysql system table, and lets you have more control over which hosts are able to connect to the servers.
  • Check number of accounts without a password - Identifies all users who do not have a password in the mysql system table.

For MongoDB, we have the following advisors:

  • MongoDB authentication enabled - Check whether the MongoDB instance is running with authentication mode enabled.
  • Authorization check - Check whether MongoDB users are authorized with too permissive role for access control.

For more details on how does ClusterControl performs the security checks, you can look at the advisor JavaScript-like source code under Manage -> Developer Studio. You can see the execution results from the Advisors page:

Multiple Network Interfaces

Having multiple NICs on the database hosts allows you to separate database traffic from management traffic. One network is used by the database nodes in order to communicate to each other, and this network is not exposed to any public network. The other network is used by ClusterControl, for management purposes. ClusterControl is able to deploy such a multi-network setup. Consider the following architecture diagram:

To import the above database cluster into ClusterControl, one would specify the primary IP address of the database hosts. Then, it is possible to choose the management network as well as the data network:

ClusterControl can also work in an environment without Internet access, with the databases being totally isolated from the public network. The majority of the features will work just fine. If the ClusterControl host is configured with Internet, it is also capable of cloning the database vendor's repository for the internet-less database servers. Just go to Settings (top menu) -> Repositories -> Create New Repository and set the options to fit the target database server environment:

The mirroring may take about 10 to 20 minutes depending on the internet connection, you will see the new item in the list later on. You can then pick this repository instead when scaling or deploying a new cluster, without the need for the database hosts to have any Internet connection (note that the operating system’s offline repository should be in place as well).

MySQL Users Management

The MySQL privilege system ensures that all users can perform only the operations they are allowed to. Granting is critical as you don't want to give all users complete access to your database, but you need users to have the necessary permissions to run queries and perform daily tasks.

ClusterControl provides an interactive user interface to manage the database schemas and privileges. It unifies the accounts on all MySQL servers in the cluster and simplifies the granting process. You can easily visualize the database users, so you avoid making mistakes.

As you can see in the above screenshot, ClusterControl greyed out unnecessary privileges if you only want to grant a user to a database (shopdb). "Require SSL?" is only enabled if the client/server SSL encryption is enabled while the administration privilege checkboxes are totally disabled if a specific database is defined. You can also inspect the generated GRANT statement at the bottom of the wizard, to see the statement that ClusterControl will execute to create this user. This helper looks pretty simple, but creating users and granting privileges can be error-prone.

ClusterControl also provides a list of inactive users for all database nodes in the cluster, showing off the accounts that have not been used since the last server restart:

This alerts the administrator for unnecessary accounts that exist, and that could potentially harm the server. The next step is to verify if the accounts are no longer active, and you can simply use the "Drop Selected User" option in order to remove them. Make sure you have enough database activity to ensure the list generated by ClusterControl is accurate. The longer the server uptime, the better.

Always Keep Up-to-date

For production use, it’s highly recommended for you to install the database-related packages from the vendor’s repository. Don’t rely on the default operating system repository, where the packages are usually outdated. If you are running in a cluster environment like Galera Cluster, or even MySQL Replication, you always have the choice to patch the system with minimal downtime.

ClusterControl supports automatic minor version rolling upgrade for MySQL/MariaDB with a single click. Just go to Manage -> Upgrades -> Upgrade and choose the appropriate major version for your running cluster. ClusterControl will then perform the upgrade, on one node at a time. The node will be stopped, then software will be updated, and then the node will be started again. If a node fails to upgrade, the upgrade process is aborted and the admin is notified. Upgrades should only be performed when there is as little traffic as possible on the cluster.

Major versions upgrades (e.g, from MySQL 5.6 to MySQL 5.7) are intentionally not automated. Major upgrades usually require uninstallation of the existing packages, which is a risky task to automate. Careful planning and testing is necessary for such kind of upgrades.

Database security is an important aspect of running your database in production. From all the incidents we frequently read about in the news (and there are probably many others that are not publicized), it is clear that there are groups busy out there with bad intentions. So, make sure your databases are well protected.

Updated: Become a ClusterControl DBA - Deploying your Databases and Clusters

$
0
0

We get some nice feedback with regards to our product ClusterControl, especially how easy it is to install and get going. Installing new software is one thing, but using it properly is another.

It is not uncommon to be impatient to test new software and one would rather toy around with a new exciting application than to read documentation before getting started. That is a bit unfortunate as you may miss important features or misunderstand how to use them.

This blog series covers all the basic operations of ClusterControl for MySQL, MongoDB & PostgreSQL with examples on how to make the most of your setup. It provides you with a deep dive on different topics to save you time.

These are the topics covered in this series:

  • Deploying the first clusters
  • Adding your existing infrastructure
  • Performance and health monitoring
  • Making your components HA
  • Workflow management
  • Safeguarding your data
  • Protecting your data
  • In depth use case

In today’s post, we’ll cover installing ClusterControl and deploying your first clusters.

Preparations

In this series, we will make use of a set of Vagrant boxes but you can use your own infrastructure if you like. In case you do want to test it with Vagrant, we made an example setup available from the following Github repository: https://github.com/severalnines/vagrant

Clone the repo to your own machine:

$ git clone git@github.com:severalnines/vagrant.git

The topology of the vagrant nodes is as follows:

  • vm1: clustercontrol
  • vm2: database node1
  • vm3: database node2
  • vm4: database node3

You can easily add additional nodes if you like by changing the following line:

4.times do |n|

The Vagrant file is configured to automatically install ClusterControl on the first node and forward the user interface of ClusterControl to port 8080 on your host that runs Vagrant. So if your host’s ip address is 192.168.1.10, you will find the ClusterControl UI here: http://192.168.1.10:8080/clustercontrol/

Installing ClusterControl

You can skip this if you chose to use the Vagrant file, and get the automatic installation. But installation of ClusterControl is straightforward and will take less than five minutes.

With the package installation, all you have to do is to issue the following three commands on the ClusterControl node to get it installed:

$ wget http://www.severalnines.com/downloads/cmon/install-cc
$ chmod +x install-cc
$ ./install-cc   # as root or sudo user

That’s it: it can’t get easier than this. If the installation script has not encountered any issues, then ClusterControl should be installed and up and running. You can now log into ClusterControl on the following URL: http://192.168.1.210/clustercontrol

After creating an administrator account and logging in, you will be prompted to add your first cluster.

Deploy a Galera cluster

You will be prompted to create a new database server/cluster or import an existing (i.e., already deployed) server or cluster:

We are going to deploy a Galera cluster. There are two sections that need to be filled in. The first tab is related to SSH and general settings:

To allow ClusterControl to install the Galera nodes, we use the root user that was granted SSH access by the Vagrant bootstrap scripts. In case you chose to use your own infrastructure, you must enter a user here that is allowed to do passwordless SSH to the nodes that ClusterControl will control. Just keep in mind that you have to setup passwordless SSH from ClusterControl to all database nodes by yourself beforehand.

Also make sure you disable AppArmor/SELinux. See here why.

Then, proceed to the second stage and specify the database related information and the target hosts:

ClusterControl will immediately perform some sanity checks each time you press Enter when adding a node. You can see the host summary by hovering over each defined node. Once everything is green, it means that ClusterControl has connectivity to all nodes, you can click Deploy. A job will be spawned to build the new cluster. The nice thing is that you can keep track of the progress of this job by clicking on the Activity -> Jobs -> Create Cluster -> Full Job Details:

Once the job has finished, you have just created your first cluster. The cluster overview should look like this:

In the nodes tab, you can do about any operation you normally would do on a cluster. The query monitor gives you a good overview of both running and top queries. The performance tab will help you keep a close eye on the performance of your cluster and also features the advisors that help you act proactively on trends in data. The backup tab enables you to easily schedule backups and store them on local or cloud storage. The manage tab enables you to expand your cluster or make it highly available for your applications through a load balancer.

All this functionality will be covered in later blog posts in this series.

Deploy a MySQL Replication Cluster

Deploying a MySQL Replication setup is similar to Galera database deployment, except that it has an additional tab in the deployment dialog where you can define the replication topology:

You can set up standard master-slave replication, as well as master-master replication. In case of the latter, only one master will remain writable at a time. Keep in mind that master-master replication doesn't come with conflict resolution and guaranteed data consistency, as in the case of Galera. Use this setup with caution, or look into Galera cluster. Once everything is green and you have clicked Deploy, a job will be spawned to build the new cluster.

Again, the deployment progress is available under Activity -> Jobs.

To scale out the slave (read copy), simply use the “Add Node” option in the cluster list:

After adding the slave node, ClusterControl will provision the slave with a copy of the data from its master using Xtrabackup or from any existing PITR compatible backups for that cluster.

Deploy PostgreSQL Replication

ClusterControl supports the deployment of PostgreSQL version 9.x and higher. The steps are similar with MySQL Replication deployment, where at the end of the deployment step, you can define the database topology when adding the nodes:

Similar to MySQL Replication, once the deployment completes, you can scale out by adding replications slave to the cluster. The step is as simple as selecting the master and filling in the FQDN for the new slave:

ClusterControl will then perform the necessary data staging from the chosen master using pg_basebackup, configure the replication user and enable the streaming replication. The PostgreSQL cluster overview gives you some insight into your setup:

Just like with the Galera and MySQL cluster overviews, you can find all the necessary tabs and functions here: the query monitor, performance, backup tabs all enable you to do the necessary operations.

Deploy a MongoDB Replica Set

Deploying a new MongoDB Replica Set is similar to the other clusters. From the Deploy Database Cluster dialog, pick MongoDB ReplicatSet, define the preferred database options and add the database nodes:

You can either choose to install Percona Server for MongoDB from Percona or MongoDB Server from MongoDB, Inc (formerly 10gen). You also need to specify the MongoDB admin user and password since ClusterControl will deploy by default a MongoDB cluster with authentication enabled.

After installing the cluster, you can add an additional slave or arbiter node into the replica set using the "Add Node" menu under the same dropdown from the cluster overview:

After adding the slave or arbiter to the replica set, a job will be spawned. Once this job has finished it will take a short while before MongoDB adds it to the cluster and it becomes visible in the cluster overview:

Final thoughts

With these three examples we have shown you how easy it is to set up different clusters from scratch in only a couple of minutes. The beauty of using this Vagrant setup is that, as easy as spawning this environment, you can also take it down and then spawn again. Impress your fellow colleagues by showing how quickly you can setup a working environment.

Of course it would be equally interesting to add existing hosts and already-deployed clusters into ClusterControl, and that’s what we'll cover next time.


PostgreSQL Privileges & User Management - What You Should Know

$
0
0

User management within PostgreSQL can be tricky. Typically new users are managed, in concert, within a couple of key areas in the environment. Oftentimes, privileges are perfect on one front, yet configured incorrectly on the other. This blog post will provide practical 'Tips and Tricks' for a user or role, as we will come to know it, setup within PostgreSQL.

The subject areas we will focus on are:

  • PostgreSQL's Take on Roles

You will learn about roles, role attributes, best practices for naming your roles, and common role setups.

  • The pg_hba.conf file

In this section we will look at one of the key files and its settings, for client-side connections and communication with the server.

  • Database, Table, and Column level privileges and restrictions.

Looking to configure roles for optimal performance and usage? Do your tables contain sensitive data, only accessible to privileged roles? Yet with the need to allow different roles to perform limited work? These questions and more will be exposed in this section.

PostgreSQL's Take on Roles - What is a 'Role' and how to create one?

Permissions for database access within PostgreSQL are handled with the concept of a role, which is akin to a user. Roles can represent groups of users in the PostgreSQL ecosystem as well.

PostgreSQL establishes the capacity for roles to assign privileges to database objects they own, enabling access and actions to those objects. Roles have the ability to grant membership to another role. Attributes provide customization options, for permitted client authentication.

Attributes for roles through the CREATE ROLE command, are available in the official PostgreSQL documentation.

Below, are those attributes you will commonly assign when setting up a new role. Most of these are self-explanatory. However, a brief description is provided to clear up any confusion along with example uses.

SUPERUSER - A database SUPERUSER deserves a word of caution. Bottom line, roles with this attribute can create another SUPERUSER. Matter of fact, this attribute is required to create another SUPERUSER role. Since roles with this attribute bypass all permission checks, grant this privilege judiciously.

CREATEDB - Allows the role to create databases.

CREATEROLE - With this attribute, a role can issue the CREATE ROLE command. Hence, create other roles.

LOGIN - Enables the ability to login. A role name with this attribute can be used in the client connection command. More details on this attribute with forthcoming examples.

Certain attributes have an explicit polar opposite named command and typically is the default when left unspecified.

e.g.
SUPERUSER | NOSUPERUSER
CREATEROLE |NOCREATEROLE
LOGIN |NOLOGIN

Let's look at some of these attributes in action for various configurations you can set up to get going.

Creating And Dropping Roles

Creating a role is relatively straightforward. Here's a quick example:

postgres=# CREATE ROLE $money_man;
ERROR: syntax error at or near "$"
LINE 1: CREATE ROLE $money_man;

What went wrong there? Turns out, role names cannot start with anything other than a letter.

"What about wrapping the name in double quotes?" Let's see:

postgres=# CREATE ROLE "$money_man";
CREATE ROLE

That worked, though probably not a good idea. How about a special character in the middle of the name?

postgres=# CREATE ROLE money$_man;
CREATE ROLE

No problem there. Even without double quotes, no error was returned.

I'm just not fond of the name structure of $money_man for a user. I'm dropping you $money_man and starting afresh. The DROP ROLE command takes care of removing a role. Here it is in use.

postgres=# DROP ROLE $money_man;
ERROR: syntax error at or near "$"
LINE 1: DROP ROLE $money_man;

And another error with the $money_man role. Again, resorting to the double quotes it is.

postgres=# DROP ROLE "$money_man";
DROP ROLE

The LOGIN privilege

Let's look at two different users, one with the LOGIN privilege and one without. I'll assign them passwords as well.

postgres=# CREATE ROLE nolog_user WITH PASSWORD 'pass1';
CREATE ROLE
postgres=# CREATE ROLE log_user WITH LOGIN PASSWORD 'pass2';
CREATE ROLE

Note: The passwords provided to the above fictional roles are for demonstration purposes only. You should always strive to provide unique and hardened passwords when implementing roles. While a password is better than no password, a hardened password is even better than a trivial one.

Let's assign log_user the CREATEDB and CREATEROLE attributes with the ALTER ROLE command.

postgres=# ALTER ROLE log_user CREATEROLE CREATEDB;
ALTER ROLE

You can verify these set attributes, by checking the pg_role catalog. Two columns of interest are rolcreaterole and rolcreatedb. Both are of the Boolean data type so they should be set to t for true for these attributes.

Confirm with a similar SELECT query.

postgres=# SELECT rolcreaterole, rolcreatedb FROM pg_roles WHERE rolname = 'log_user';
rolcreaterole | rolcreatedb
---------------+-------------
t | t
(1 row)
ClusterControl
Single Console for Your Entire Database Infrastructure
Find out what else is new in ClusterControl

How can you determine the existing roles present in the database?

Two available methods are the psql \du command or selecting from the pg_roles catalog.

Here they both are in use.

postgres=> \du
List of roles
Role name | Attributes | Member of
------------+------------------------------------------------------------+-----------
log_user | Create role, Create DB | {}
nolog_user | Cannot login | {}

postgres=> SELECT rolname FROM pg_roles;
rolname
----------------------
nolog_user
log_user
(2 rows)

Logging in

Let's give both roles, an opportunity to login to the server.

psql -U nolog_user -W postgres
Password for user nolog_user:
psql: FATAL: no pg_hba.conf entry for host "[local]", user "nolog_user", database "postgres", SSL off
psql -U log_user -W postgres
Password for user log_user:
psql: FATAL: no pg_hba.conf entry for host "[local]", user "log_user", database "postgres", SSL off

To resolve this issue, we have to dig into that pg_hba.conf file. The solution is discussed as we continue in this post, to that specific section.

Actionable Takeaways

  • CREATE ROLE and its counterpart, DROP ROLE, are your go-to commands for implementing and removing roles.
  • ALTER ROLE handles changing the attributes of a role.
  • Roles are valid within all databases due to definition at the database cluster level.
  • Keep in mind, creating a role name beginning with a special character, requires you to 'address' it with double quotes.
  • Roles and their privileges are established using attributes.
  • To establish roles needing the LOGIN attribute by default, CREATE USER is an optional command at your disposal. Used in lieu of CREATE ROLE role_name LOGIN, they are essentially equal.

The pg_hba.conf file - Establishing common ground between the server and the client

Covering all aspects and settings for the pg_hba.conf file in one blog post would be daunting at best. Instead, this section will present common pitfalls you may encounter and solutions to remedy them.

Successful connections require a conjunctive effort from both parts as a whole. Roles connecting to the server, must still meet access restrictions set at the database level, after passing the settings in the pg_hba.conf file.

Relevant examples of this relationship are included as this section progresses.

To locate your pg_hba.conf file, issue a similar SELECT query, on the pg_settingsVIEW. You must be logged in as a SUPERUSER to query this VIEW.

postgres=# SELECT name, setting
FROM pg_settings WHERE name LIKE '%hba%';
name | setting
----------+-------------------------------------
hba_file | /etc/postgresql/10/main/pg_hba.conf
(1 row)

The pg_hba.conf file contains records specifying one of seven available formats for a given connection request. See the full spectrum here .

For the purpose of this blog post, we will look at settings you can use for a local environment.

Perhaps this server is for your continued learning and study (as mine is).

I must make special note that these settings are not the optimal settings for a hardened system containing multiple users.

The fields for this type of connection are:

local database user auth-method [auth-options]

Where they mean:

local - connections are attempted with Unix-domain sockets.

database - Specifies the database(s) named for this record match.

user - The database user name matched for this record. A comma-separated list of multiple users or all is allowed for this field as well.

auth-method - Is used when a connection matches this unique record. The possible choices for this field is:

  • trust
  • reject
  • scram-sha-256
  • md5
  • password
  • gss
  • sspi
  • ident
  • peer
  • ldap
  • radius
  • cert
  • pam
  • bsd

The lines set in pg_hba.conf file for roles nolog_user and log_user look like this:

local all nolog_user password
local all log_user password

Note: Since password is sent in clear text, this should not be used in untrusted environments with untrusted networks.

Let's look at three interesting columns from the pg_hba_file_rulesVIEW with the below query. Again your role needs the SUPERUSER attribute to query this VIEW.

postgres=# SELECT database, user_name, auth_method
postgres-# FROM pg_hba_file_rules
postgres-# WHERE CAST(user_name AS TEXT) LIKE '%log_user%';
database | user_name | auth_method
----------+--------------+-------------
{all} | {nolog_user} | password
{all} | {log_user} | password
(2 rows)

We can see identical information from the lines provided above found in the pg_hba.conf file as we can from the accompanying query. At first glance, it looks as if both roles can log in.

We will test and confirm.

psql -U nolog_user -W postgres
Password for user nolog_user:
psql: FATAL: role "nolog_user" is not permitted to log in
psql -U log_user -W postgres
Password for user log_user:
psql (10.1)
Type "help" for help.
postgres=>

The key point here is, although nolog_user and log_user are both able to login according to the pg_hba.conf file, only log_user is allowed to actually login.

Where log_user passed the database level access restrictions (By having the LOGIN attribute), nolog_user did not.

Let's edit log_user's line in the pg_hba.conf file and change the database name this role is allowed to access. Here is the change, indicating log_user can now login to the trial database only.

local trial log_user password

First let's try to login to the postgres database, which log_user previously had access to due to the all flag.

$ psql -U log_user -W postgres
Password for user log_user:
psql: FATAL: no pg_hba.conf entry for host "[local]", user "log_user", database "postgres", SSL off

Now with the trial database log_user does have privilege to

$ psql -U log_user -W trial
Password for user log_user:
psql (10.1)
Type "help" for help.
trial=>

No error there and the trial=> prompt shows the currently connected database.

These settings apply within the server environment as well, once a connection is established.

Let's attempt a connection to that postgres database again:

trial=> \c postgres;
Password for user log_user:
FATAL: no pg_hba.conf entry for host "[local]", user "log_user", database "postgres", SSL off
Previous connection kept

Through the examples presented here, you should be aware of the customization options for the roles in your cluster.

Note: Oftentimes, reloading the pg_hba.conf file is required for changes to take effect.

Use the pg_ctl utility to reload your server.

The syntax would be:

pg_ctl reload [-D datadir] [-s]

To know where your datadir is, you can query the pg_settings system VIEW, if logged in as a SUPERUSER with a similar SELECT query as below.

postgres=# SELECT setting FROM pg_settings WHERE name = 'data_directory';
           setting
-----------------------------
 /var/lib/postgresql/10/main
(1 row)

Then, give your shell to the postgres user (or other SUPERUSER) with:

$ sudo -u postgres bash

Unless you have added the pg_ctl utility to your $PATH, you must fully qualify it for use, then pass the command to execute, along with the datadir location.

Here is an example:

$ /usr/lib/postgresql/10/bin/pg_ctl reload -D /var/lib/postgresql/10/main
server signaled

Let’s check the server's status with:

$ /usr/lib/postgresql/10/bin/pg_ctl status -D /var/lib/postgresql/10/main
pg_ctl: server is running (PID: 1415)
/usr/lib/postgresql/10/bin/postgres "-D""/var/lib/postgresql/10/main""-c""config_file=/etc/postgresql/10/main/postgresql.conf"

Actionable takeaways

  • Roles must pass requirements from both the pg_hba.conf file and database level access privileges.
  • pg_hba.conf file is checked from the top down, for each connection request. Order in the file is significant.

Database, Table, and Column privileges and restrictions - Tailor fit roles for tasks and responsibilities

In order for roles to use database objects (tables, views, columns, functions, etc...), they must be granted access privileges to them.

The GRANT command defines these essential privileges.

We'll go over a few examples to get the essence of its use.

Creating databases

Since log_user was granted the CREATEDB and CREATEROLE attributes, we can use this role to create a test database named trial.

postgres=> CREATE DATABASE trial:
CREATE DATABASE

In addition to creating a new ROLE:

postgres=> CREATE ROLE db_user WITH LOGIN PASSWORD 'scooby';
CREATE ROLE

Finally, log_user will connect to the new trial database:

postgres=> \c trial;
Password for user log_user:
You are now connected to database "trial" as user "log_user".
trial=>

Notice the prompt changed to the name 'trial' indicating that we are connected to that database.

Let's utilize log_user to CREATE a mock table.

trial=> CREATE TABLE another_workload(
trial(> id INTEGER,
trial(> first_name VARCHAR(20),
trial(> last_name VARCHAR(20),
trial(> sensitive_info TEXT);
CREATE TABLE

Role log_user recently created a helper role, db_user. We require db_user to have limited privileges for table another_workload.

Undoubtedly, the sensitive_info column should not be accessed by this role. INSERT, UPDATE, and DELETE commands should not be granted at this time either, until db_user meets certain expectations.

However, db_user is required to issue SELECT queries. How can we limit this roles abilities within the another_workload table?

First let's examine the exact syntax found in the PostgreSQL GRANT command docs, at the table level.

GRANT { { SELECT | INSERT | UPDATE | REFERENCES } ( column_name [, ...] )
[, ...] | ALL [ PRIVILEGES ] ( column_name [, ...] ) }
ON [ TABLE ] table_name [, ...]
TO role_specification [, ...] [ WITH GRANT OPTION ]

Next, we implement the requirements set forth for role db_user, applying specific syntax.

trial=> GRANT SELECT (id, first_name, last_name) ON TABLE another_workload TO db_user;
GRANT

Notice just after the SELECT keyword, we listed the columns that db_user can access. Until changed, should db_user attempt SELECT queries on the sensitive_info column, or any other command for that matter, those queries will not be executed.

With db_user logged in, we'll put this into practice, attempting a SELECT query to return all columns and records from the table.

trial=> SELECT * FROM another_workload;
ERROR: permission denied for relation another_workload

Column sensitive_info is included in this query. Therefore, no records are returned to db_user.

But db_user can SELECT the allowable columns

trial=> SELECT id, first_name, last_name
trial-> FROM another_workload;
id | first_name | last_name
-----+------------+-----------
10 | John | Morris
191 | Jannis | Harper
2 | Remmy | Rosebuilt
(3 rows)

That works just fine.

We will test INSERT, UPDATE, and DELETE commands as well.

trial=> INSERT INTO another_workload(id,first_name,last_name,sensitive_info)
VALUES(17,'Jeremy','Stillman','key code:400Z');
ERROR: permission denied for relation another_workload
trial=> UPDATE another_workload
trial-> SET id = 101
trial-> WHERE id = 10;
ERROR: permission denied for relation another_workload
trial=> DELETE FROM another_workload
trial-> WHERE id = 2;;
ERROR: permission denied for relation another_workload

By not assigning INSERT, UPDATE, or DELETE commands to db_user, the role is denied access to using them.

With the plethora of available options, configuring your role is virtually limitless. You can make them fully functional, able to execute any command, or as constrained as your requirements dictate.

Actionable takeaways

  • Roles are provided access privileges to database objects via the GRANT command.
  • Database objects and commands against those objects, is highly configurable within the PostgreSQL environment.

Closing

Through this blog post's provided examples, you should have a better understanding of:

  1. Creating a role with specific attributes.
  2. Setting a workable connection between the client and server, allowing roles login access to databases.
  3. Highly customizing your roles to meet individual requirements for database, table, and column level access by implementing necessary attributes.

PostgreSQL Schema Management Basics

$
0
0

Are you wondering what Postgresql schemas are and why they are important and how you can use schemas to make your database implementations more robust and maintainable? This article will introduce the basics of schemas in Postgresql and show you how to create them with some basic examples. Future articles will delve into examples of how to secure and use schemas for real applications.

Firstly, to clear up potential terminology confusion, let’s understand that in the Postgresql world, the term “schema” is maybe somewhat unfortunately overloaded. In the broader context of relational database management systems (RDBMS), the term “schema” might be understood to refer to the overall logical or physical design of the database, i.e., the definition of all the tables, columns, views, and other objects that constitute the database definition. In that broader context a schema might be expressed in an entity-relationship (ER) diagram or a script of data definition language (DDL) statements used to instantiate the application database.

In the Postgresql world, the term “schema” might be better understood as a “namespace”. In fact, in the Postgresql system tables, schemas are recorded in table columns called “name space”, which, IMHO, is more accurate terminology. As a practical matter, whenever I see “schema” in the context of Postgresql I silently reinterpret it as saying “name space”.

But you may ask: “What's a name space?” Generally, a name space is a rather flexible means of organizing and identifying information by name. For example, imagine two neighboring households, the Smiths, Alice and Bob, and the Jones, Bob and Cathy (cf. Figure 1). If we used only first names, it might get confusing as to which person we meant when talking about Bob. But by adding the surname name, Smith or Jones, we uniquely identify which person we mean.

Oftentimes, name spaces are organized in a nested hierarchy. This allows efficient classification of vast amounts of information into very finely-grained structure, such as, for example the internet domain name system. At the top level, “.com”, “.net”, “.org”, “.edu”, and etc. define broad name spaces within which are registered names for specific entities, so for example, “severalnines.com” and “postgresql.org” are uniquely defined. But under each of those there are a number of common sub-domains such as “www”, “mail”, and “ftp”, for example, which alone are duplicative, but within the respective name spaces are unique.

Postgresql schemas serve this same purpose of organizing and identifying, however, unlike the second example above, Postgresql schemas cannot be nested in a hierarchy. While a database may contain many schemas, there is only ever one level and so within a database, schema names must be unique. Also, every database must include at least one schema. Whenever a new database is instantiated, a default schema named “public” is created. The contents of a schema include all the other database objects such as tables, views, stored procedures, triggers, and etc. To visualize, refer to Figure 2, which depicts a matryoshka doll-like nesting showing where schemas fit into the structure of a Postgresql database.

Besides simply organizing database objects into logical groups to make them more manageable, schemas serve the practical purpose of avoiding name collision. One operational paradigm involves defining a schema for each database user so as provide some degree of isolation, a space where users can define their own tables and views without interfering with each other. Another approach is to install third party tools or data base extensions in individual schemas so as to keep all the related components logically together. A later article in this series will detail a novel approach to robust application design, employing schemas as a means of indirection to limit exposure of the database physical design and instead present a user interface which resolves synthetic keys and facilitates long-term maintenance and configuration management as system requirements evolve.

Let’s do some code!

The simplest command to create a schema within a database is

CREATE SCHEMA hollywood;

This command requires create privileges in the database, and the newly-created schema “hollywood” will be owned by user invoking the command. A more complex invocation may include optional elements specifying a different owner, and may even include DDL statements instantiating data base objects within the schema all in one command!

The general format is

CREATE SCHEMA schemaname [ AUTHORIZATION username ] [ schema_element [ ... ] ]

where “username” is who will own the schema and “schema_element” may be one of certain DDL commands (refer to Postgresql documentation for specifics). Superuser privileges are required to use the AUTHORIZATION option.

So for example, to create a schema named “hollywood” containing a table named “films” and view named “winners” in one command, you could do

CREATE SCHEMA hollywood
    CREATE TABLE films (title text, release date, awards text[])
    CREATE VIEW winners AS
        SELECT title, release FROM films WHERE awards IS NOT NULL;

Additional database objects may be subsequently created directly, for example an additional table would be added to the schema with

CREATE TABLE hollywood.actors (name text, dob date, gender text);

Note in the above example the prefixing of the table name with the schema name. This is required because by default, that is without explicit schema specification, new database objects are created within whatever is the current schema, which we will cover next.

Recall how in the first name space example above, we had two persons named Bob, and we described how to deconflict or distinguish them by including the surname. But within each of the Smith and Jones households separately, each family understands “Bob” to refer to the one that goes with that particular household. So for instance in the context of each respective household, Alice does not need to address her husband as Bob Jones, and Cathy need not refer to her husband as Bob Smith: they can each just say “Bob”.

The Postgresql current schema is kind of like the household in the above example. Objects in the current schema can be referenced unqualified, but referring to similarly-named objects in other schemas requires qualifying the name by prefixing the schema name as above.

The current schema is derived from the “search_path” configuration parameter. This parameter stores a comma-separated list of schema names and can be examined with the command

SHOW search_path;

or set to a new value with

SET search_path TO schema [, schema, ...];

The first schema name in the list is the “current schema” and is where new objects are created if specified without schema name qualification.

The comma-separated list of schema names also serves to determine the search order by which the system locates existing unqualified named objects. For example, back to the Smith and Jones neighborhood, a package delivery addressed just to “Bob” would require visiting at each household until the first resident named “Bob” is found. Note, this might not be the intended recipient. The same logic applies for Postgresql. The system searches for tables, views, and other objects within schemas in the order of the search_path, and then the first found name match object is used. Schema-qualified named objects are used directly without reference to the search_path.

In the default configuration, querying the search_path configuration variable reveals this value

SHOW search_path;
 Search_path
--------------"$user", public

The system interprets the first value shown above as the current logged in user name and accommodates the use case mentioned earlier where each user is allocated a user-named schema for a work space separate from other users. If no such user-named schema has been created, that entry is ignored and the “public” schema becomes the current schema where new objects are created.

Thus, back to our earlier example of creating the “hollywood.actors” table, if we had not qualified the table name with the schema name, then the table would have been created in the public schema. If we anticipated creating all objects within a specific schema, then it might be convenient to set the search_path variable such as

SET search_path TO hollywood,public;

facilitating the shorthand of typing unqualified names to create or access database objects.

There is also a system information function which returns the current schema with a query

select current_schema();

In case of fat-fingering the spelling, the owner of a schema may change the name, provided the user also has create privileges for the database, with the

ALTER SCHEMA old_name RENAME TO new_name;

And lastly, to delete a schema from a database, there is a drop command

DROP SCHEMA schema_name;

The DROP command will fail if the schema contains any objects, so they must be deleted first, or you can optionally recursively delete a schema all its contents with the CASCADE option

DROP SCHEMA schema_name CASCADE;

These basics will get you started with understanding schemas!

How to Benchmark PostgreSQL Performance

$
0
0

The purpose of benchmarking a database is not only to check capability of database, but also the behavior of a particular database against your application. Different hardwares provide different results based on the benchmarking plan that you set. It is very important to isolate the server (the actual one being benchmarked) from other elements like the servers driving the load, or the servers used to collect and store performance metrics. As part of the benchmarking exercise, you must get the application characteristics like a) Is the application is read or write intensive? or b) what is the read/write split (e.g. 80:20)? or c) How large is the dataset?, is the data and structure representative of the actual production database, etc.

PostgreSQL is world's most advanced open source database. If any enterprise RDBMS customer wants to migrate their database to opensource, then PostgreSQL would be the first option to evaluate.

This post covers the following:

  • How to benchmark PostgreSQL
  • What are the key performance factors in PostgreSQL
  • What are levers you can pull to increase performance
  • What are performance pitfalls to avoid
  • What are common mistakes people make?
  • How do you know if your system is performing? What tools can you use?

How to benchmark PostgreSQL

The standard tool to benchmark PostgreSQL is pgbench. By default, pgbench tests are based on TPC-B. It involves 5 SELECT, INSERT, and UPDATE commands per transaction. However, depending on your application behavior, you can write your own script files. Let us look into the default and some script oriented test results. We are going to use the latest version of PostgreSQL for these tests, which is PostgreSQL 10 at the time of writing. You can install it using ClusterControl, or using the instructions here: https://www.openscg.com/bigsql/package-manager/.

Specs of machine

Version: RHEL 6 - 64 bit
Memory : 4GB
Processors: 4
Storage: 50G
PostgreSQL version: 10.0
Database Size: 15G

Before you run benchmarking with pgbench tool, you would need to initialize it below command:

-bash-4.1$ ./pgbench -i -p 5432 -d postgres
NOTICE:  table "pgbench_history" does not exist, skipping
NOTICE:  table "pgbench_tellers" does not exist, skipping
NOTICE:  table "pgbench_accounts" does not exist, skipping
NOTICE:  table "pgbench_branches" does not exist, skipping
creating tables…
100000 of 100000 tuples (100%) done (elapsed 0.18 s, remaining 0.00 s)
Vacuum…
set primary keys…
done.

As shown in the NOTICE messages, it creates pgbench_history, pgbench_tellers, pgbench_accounts, and pgbench_branches tables to run the transactions for benchmarking.

Here is a simple test with 10 clients:

-bash-4.1$ ./pgbench -c 10
starting vacuum...end.
transaction type: <builtin: TPC-B (sort of)>
scaling factor: 1
query mode: simple
number of clients: 10
number of threads: 1
number of transactions per client: 10
number of transactions actually processed: 100/100
latency average = 13.516 ms
tps = 739.865020 (including connections establishing)
tps = 760.775629 (excluding connections establishing)

As you see, it ran with 10 clients and 10 transaction per client. It gave you 739 transactions/sec.It gave you 739 transactions/sec. If you want to run it for specific amount of time, you can use "-T" option. In general, a 15 mins or 30 mins run is sufficient.

As of now, we talked about how to run pgbench, however not about what should be options. Before you start the benchmarking, you should get proper details from application team on:

  • What type of workload?
  • How many concurrent sessions?
  • What is the average result set of queries?
  • What are the expected tps(transaction per sec)?

Here is an example for read-only work loads. You can use "-S" option to use only SELECTs which falls under read-only. Note that -n is to skip vacuuming on tables.

-bash-4.1$ ./pgbench -c 100 -T 300 -S -n
transaction type: <builtin: select only>
scaling factor: 1000
query mode: simple
number of clients: 100
number of threads: 1
duration: 300 s
number of transactions actually processed: 15741
latency average = 1916.650 ms
tps = 52.174363 (including connections establishing)
tps = 52.174913 (excluding connections establishing)
-bash-4.1$

Latency here is the average elapsed transaction time of each statement executed by every client. It gives 52 tps with the hardware given. As this benchmark is for a read-only environment, let us try tweaking shared_buffers and effective_cache_size parameters in postgresql.conf file and check the tps count. They are at default values in the above test, try increasing the values, and check the results.

-bash-4.1$ ./pgbench -c 100 -T 300 -S -n
transaction type: <builtin: select only>
scaling factor: 1000
query mode: simple
number of clients: 100
number of threads: 1
duration: 300 s
number of transactions actually processed: 15215
latency average = 1984.255 ms
tps = 68.396758 (including connections establishing)
tps = 68.397322 (excluding connections establishing)

Changing the parameters improved performance by 30%.

pgbench typically runs transactions on its own tables. If you have a workload of 50% reads and 50% writes (or a 60:40 environment), you can create a script file with a set of statements to achieve the expected workload.

-bash-4.1$ cat /tmp/bench.sql
INSERT INTO test_bench VALUES(1,'test');
SELECT * FROM test_bench WHERE id=1;
SELECT * FROM test_bench WHERE id=2;
-bash-4.1$ ./pgbench -c 100 -T 300 -S -n -f /tmp/bench.sql
transaction type: multiple scripts
scaling factor: 1000
query mode: simple
number of clients: 100
number of threads: 1
duration: 300 s
number of transactions actually processed: 25436
latency average = 1183.093 ms
tps = 84.524217 (including connections establishing)
tps = 84.525206 (excluding connections establishing)
SQL script 1: <builtin: select only>
 - weight: 1 (targets 50.0% of total)
 - 12707 transactions (50.0% of total, tps = 42.225555)
 - latency average = 914.240 ms
 - latency stddev = 558.013 ms
SQL script 2: /tmp/bench.sql
 - weight: 1 (targets 50.0% of total)
 - 12729 transactions (50.0% of total, tps = 42.298662)
 - latency average = 1446.721 ms
 - latency stddev = 765.933 ms


What are the key performance factors in PostgreSQL

If we consider a real production environment, it is consolidated with different components at application level, hardware like CPU and memory, and the underlying operating system. We install PostgreSQL on top of the operating system to communicate with other components of the production environment. Every environment is different and overall performance will be degraded if it is not properly configured. In PostgreSQL, some queries run faster and some slow, however it depends on configuration that has been set. The goal of database performance optimization is to maximize the database throughput and minimize connections to achieve the largest possible throughput. Below are few key performance factors that affect the database:

  • Workload
  • Resource
  • Optimization
  • Contention

Workload consists of batch jobs, dynamic queries for online transactions, data analytics queries which are used for generating reports. Workload may be different during the period of the day, week or month, and depends on applications. Optimization of every database is unique. It can be database level configuration or query level optimization. We will be covering more about optimization in further sections of the post. Contention is the condition where two or more components of the workload are attempting to use a single resource in a conflicting way. As contention increases, throughput decreases.

What are tips and best practices

Here are few tips and best practices that you can follow to avoid performance issues:

  • You can consider running maintenance activities like VACUUM and ANALYZE after a large modification in your database. This helps the planner to come up with the best plan to execute queries.
  • Look for any need to index tables. It makes queries run much faster, rather than having to do full table scans.
  • To make an index traversal much faster, you can use CREATE TABLE AS or CLUSTER commands to cluster rows with similar key values.
  • When you see a performance problem, use the EXPLAIN command to look at the plan on how the optimizer has decided to execute your query.
  • You can try changing the plans by influencing the optimizer by modifying query operators. For example, if you see a sequential scan for your query, you can disable seq scan using "SET ENABLE_SEQSCAN TO OFF". There is no guarantee that the optimizer would not choose that operator if you disable it. The optimizer just considers the operator to be much more expensive. More details are here: https://www.postgresql.org/docs/current/static/runtime-config-query.html
  • You can also try changing the costs parameters like CPU_OPERATOR_COST, CPU_INDEX_TUPLE_COST, CPU_TUPLE_COST, RANDOM_PAGE_COST, and EFFECTIVE_CACHE_SIZE to influence the optimizer. More details are here: https://www.postgresql.org/docs/current/static/runtime-config-query.html#RUNTIME-CONFIG-QUERY-CONSTANTS
  • Always filter data on the server rather than in client application. It will minimize the network traffic and gives better performance.
  • To perform common operations, it is always recommended to use server-side procedures (triggers and functions). Server-side triggers or functions are parsed, planned, and optimized the first time they are used, not every time.

What are common mistakes people make

One of the common mistakes that people do is running the database server and database with default parameters. The PostgreSQL default configuration is tested in few environments, however not every application would find those values optimal. So you need to understand your application behavior and based on it, set your configuration parameters. You can use the pgTune tool to get values for your parameters based on the hardware that you are using. You can have a look at: http://pgtune.leopard.in.ua/. However, keep in mind that you will have to test your application with changes that you make, to see if there are any performance degradation with the changes.

Another thing to consider would be indexing the database. Indexes help to fetch the data faster, however more indexes create issues with loading the data. So always check if any unused indexes are there in the database, and get rid of those to reduce the maintenance of those indexes and improve loading of data.

An Overview of Database Indexing in PostgreSQL

$
0
0

Database Indexing is the use of special data structures that aim at improving performance, by achieving direct access to data pages. A database index works like the index section of a printed book: by looking in the index section, it is much faster to identify the page(s) which contain the term we are interested in. We can easily locate the pages and access them directly. This is instead of scanning the pages of the book sequentially, till we find the term we are looking for.

Indexes are an essential tool in the hands of a DBA. Using indexes can provide great performance gains for a variety of data domains. PostgreSQL is known for its great extensibility and the rich collection of both core and 3rd party addons, and indexing is no exception to this rule. PostgreSQL indexes cover a rich spectrum of cases, from the simplest b-tree indexes on scalar types to geospatial GiST indexes to fts or json or array GIN indexes.

Indexes, however, as wonderful as they seem (and actually are!) don’t come for free. There is a certain penalty that goes with writes on an indexed table. So the DBA, before examining her options to create a specific index, should first make sure that the said index makes sense in the first place, meaning that the gains from its creation will outweigh the performance loss on writes.

PostgreSQL basic index terminology

Before describing the types of indexes in PostgreSQL and their use, let’s take a look at some terminology that any DBA will come across sooner or later when reading the docs.

  • Index Access Method (also called as Access Method): The index type (B-tree, GiST, GIN, etc)
  • Type: the data type of the indexed column
  • Operator: a function between two data types
  • Operator Family: cross data type operator, by grouping operators of types with similar behaviour
  • Operator Class (also mentioned as index strategy): defines the operators to be used by the index for a column

In PostgreSQL’s system catalog, access methods are stored in pg_am, operator classes in pg_opclass, operator families in pg_opfamily. The dependencies of the above are shown in the diagram below:

Types of Indexes in PostgreSQL

PostgreSQL provides the following Index types:

  • B-tree: the default index, applicable for types that can be sorted
  • Hash: handles equality only
  • GiST: suitable for non-scalar data types (e.g. geometrical shapes, fts, arrays)
  • SP-GiST: space partitioned GIST, an evolution of GiST for handling non-balanced structures (quadtrees, k-d trees, radix trees)
  • GIN: suitable for complex types (e.g. jsonb, fts, arrays )
  • BRIN: a relatively new type of index which supports data that can be sorted by storing min/max values in each block

Low we’ll try to get our hands dirty with some real world examples. All examples given are done with PostgreSQL 10.0 (with both 10 and 9 psql clients) on FreeBSD 11.1.

B-tree Indexes

Let’s suppose we have the following table:

create table part (
id serial primary key, 
partno varchar(20) NOT NULL UNIQUE, 
partname varchar(80) NOT NULL, 
partdescr text,
machine_id int NOT NULL
);
testdb=# \d part
                                  Table "public.part"
   Column       |         Type          |                     Modifiers                     
------------+-----------------------+---------------------------------------------------
 id         | integer                 | not null default nextval('part_id_seq'::regclass)
 partno     | character varying(20)| not null
 partname       | character varying(80)| not null
 partdescr      | text                    |
 machine_id     | integer                 | not null
Indexes:
    "part_pkey" PRIMARY KEY, btree (id)
    "part_partno_key" UNIQUE CONSTRAINT, btree (partno)

When we define this rather common table, PostgreSQL creates two unique B-tree indexes behind the scenes: part_pkey and part_partno_key. So every unique constraint in PostgreSQL is implemented with a unique INDEX. Lets populate our table with a million rows of data:

testdb=# with populate_qry as (select gs from generate_series(1,1000000) as gs )
insert into part (partno, partname,machine_id) SELECT 'PNo:'||gs, 'Part '||gs,0 from populate_qry;
INSERT 0 1000000

Now let’s try to do some queries on our table. First we tell psql client to report query times by typing \timing:

testdb=# select * from part where id=100000;
   id   |   partno   |  partname   | partdescr | machine_id
--------+------------+-------------+-----------+------------
 100000 | PNo:100000 | Part 100000 |           |          0
(1 row)

Time: 0,284 ms
testdb=# select * from part where partno='PNo:100000';
   id   |   partno   |  partname   | partdescr | machine_id
--------+------------+-------------+-----------+------------
 100000 | PNo:100000 | Part 100000 |           |          0
(1 row)

Time: 0,319 ms

We observe that it takes only fractions of the millisecond to get our results. We expected this since for both columns used in the above queries, we have already defined the appropriate indexes. Now let’s try to query on column partname, for which no index exists.

testdb=# select * from part where partname='Part 100000';
   id   |   partno   |  partname   | partdescr | machine_id
--------+------------+-------------+-----------+------------
 100000 | PNo:100000 | Part 100000 |           |          0
(1 row)

Time: 89,173 ms

Here we see clearly that for the non indexed column, the performance drops significantly. Now lets create an index on that column, and repeat the query:

testdb=# create index part_partname_idx ON part(partname);
CREATE INDEX
Time: 15734,829 ms (00:15,735)
testdb=# select * from part where partname='Part 100000';
   id   |   partno   |  partname   | partdescr | machine_id
--------+------------+-------------+-----------+------------
 100000 | PNo:100000 | Part 100000 |           |          0
(1 row)

Time: 0,525 ms

Our new index part_partname_idx is also a B-tree index (the default). First we note that the index creation on the million rows table took a significant amount of time, about 16 seconds. Then we observe that our query speed was boosted from 89 ms down to 0.525 ms. B-tree indexes, besides checking for equality, can also help with queries involving other operators on ordered types, such as <,<=,>=,>. Lets try with <= and >=

testdb=# select count(*) from part where partname>='Part 9999900';
 count
-------
     9
(1 row)

Time: 0,359 ms
testdb=# select count(*) from part where partname<='Part 9999900';
 count  
--------
 999991
(1 row)

Time: 355,618 ms

The first query is much faster than the second, by using the EXPLAIN (or EXPLAIN ANALYZE) keywords we can see if the actual index is used or not:

testdb=# explain select count(*) from part where partname>='Part 9999900';
                                       QUERY PLAN                                        
-----------------------------------------------------------------------------------------
 Aggregate  (cost=8.45..8.46 rows=1 width=8)
   ->  Index Only Scan using part_partname_idx on part  (cost=0.42..8.44 rows=1 width=0)
         Index Cond: (partname >= 'Part 9999900'::text)
(3 rows)

Time: 0,671 ms
testdb=# explain select count(*) from part where partname<='Part 9999900';
                                       QUERY PLAN                                       
----------------------------------------------------------------------------------------
 Finalize Aggregate  (cost=14603.22..14603.23 rows=1 width=8)
   ->  Gather  (cost=14603.00..14603.21 rows=2 width=8)
         Workers Planned: 2
         ->  Partial Aggregate  (cost=13603.00..13603.01 rows=1 width=8)
               ->  Parallel Seq Scan on part  (cost=0.00..12561.33 rows=416667 width=0)
                     Filter: ((partname)::text <= 'Part 9999900'::text)
(6 rows)

Time: 0,461 ms

In the first case, the query planner chooses to use the part_partname_idx index. We also observe that this will result in an index-only scan which means no access to the data tables at all. In the second case the planner determines that there is no point in using the index as the returned results are a big portion of the table, in which case a sequential scan is thought to be faster.

Hash Indexes

Use of hash indexes up to and including PgSQL 9.6 was discouraged due to reasons having to do with lack of WAL writing. As of PgSQL 10.0 those issues were fixed, but still hash indexes made little sense to use. There are efforts in PgSQL 11 to make hash indexes a first class index method along with its bigger brothers (B-tree, GiST, GIN). So, with this in mind, let’s actually try a hash index in action.

We will enrich our part table with a new column parttype and populate it with values of equal distribution, and then run a query that tests for parttype equal to ‘Steering’:

testdb=# alter table part add parttype varchar(100) CHECK (parttype in ('Engine','Suspension','Driveline','Brakes','Steering','General')) NOT NULL DEFAULT 'General';
ALTER TABLE
Time: 42690,557 ms (00:42,691)
testdb=# with catqry as  (select id,(random()*6)::int % 6 as cat from part)
update part SET parttype = CASE WHEN cat=1 THEN 'Engine' WHEN cat=2 THEN 'Suspension' WHEN cat=3 THEN 'Driveline' WHEN cat=4 THEN 'Brakes' WHEN cat=5 THEN 'Steering' ELSE 'General' END FROM catqry WHERE part.id=catqry.id;
UPDATE 1000000
Time: 46345,386 ms (00:46,345)
testdb=# select count(*) from part where id % 500 = 0 AND parttype = 'Steering';
 count
-------
   322
(1 row)

Time: 93,361 ms

Now we create a Hash index for this new column, and retry the previous query:

testdb=# create index part_parttype_idx ON part USING hash(parttype);
CREATE INDEX
Time: 95525,395 ms (01:35,525)
testdb=# analyze ;
ANALYZE
Time: 1986,642 ms (00:01,987)
testdb=# select count(*) from part where id % 500 = 0 AND parttype = 'Steering';
 count
-------
   322
(1 row)

Time: 63,634 ms

We note the improvement after using the hash index. Now we will compare the performance of a hash index on integers against the equivalent b-tree index.

testdb=# update part set machine_id = id;
UPDATE 1000000
Time: 392548,917 ms (06:32,549)
testdb=# select * from part where id=500000;
   id   |   partno   |  partname   | partdescr | machine_id |  parttype  
--------+------------+-------------+-----------+------------+------------
 500000 | PNo:500000 | Part 500000 |           |     500000 | Suspension
(1 row)

Time: 0,316 ms
testdb=# select * from part where machine_id=500000;
   id   |   partno   |  partname   | partdescr | machine_id |  parttype  
--------+------------+-------------+-----------+------------+------------
 500000 | PNo:500000 | Part 500000 |           |     500000 | Suspension
(1 row)

Time: 97,037 ms
testdb=# create index part_machine_id_idx ON part USING hash(machine_id);
CREATE INDEX
Time: 4756,249 ms (00:04,756)
testdb=#
testdb=# select * from part where machine_id=500000;
   id   |   partno   |  partname   | partdescr | machine_id |  parttype  
--------+------------+-------------+-----------+------------+------------
 500000 | PNo:500000 | Part 500000 |           |     500000 | Suspension
(1 row)

Time: 0,297 ms

As we see, with the use of hash indexes, the speed of queries that check for equality is very close to the speed of B-tree indexes. Hash indexes are said to be marginally faster for equality than B-trees, in fact we had to try each query two or three times until hash index gave a better result than the b-tree equivalent.

GiST Indexes

GiST (Generalized Search Tree) is more than a single kind of index, but rather an infrastructure to build many indexing strategies. The default PostgreSQL distribution provides support for geometric data types, tsquery and tsvector. In contrib there are implementations of many other operator classes. By reading the docs and the contrib dir, the reader will observe that there is a rather big overlap between GiST and GIN use cases: int arrays, full text search to name the main cases. In those cases GIN is faster, and the official documentation explicitly states that. However, GiST provides extensive geometric data type support. Also, as at the time of this writing, GiST (and SP-GiST) is the only meaningful method that can be used with exclusion constraints. We will see an example on this. Let us suppose (staying in the field of mechanical engineering) that we have a requirement to define machines type variations for a particular machine type, that are valid for a certain period in time; and that for a particular variation, no other variation can exist for the same machine type whose period in time overlaps (conflicts) with the particular variation period.

create table machine_type (
	id SERIAL PRIMARY KEY, 
	mtname varchar(50) not null, 
	mtvar varchar(20) not null, 
	start_date date not null, 
	end_date date, 
	CONSTRAINT machine_type_uk UNIQUE (mtname,mtvar)
);

Above we tell PostgreSQL that for every machine type name (mtname) there can be only one variation (mtvar). Start_date denotes the starting date of the period in which this machine type variation is valid, and end_date denotes the ending date of this period. Null end_date means that the machine type variation is currently valid. Now we want to express the non-overlapping requirement with a constraint. The way to do this is with an exclusion constraint:

testdb=# alter table machine_type ADD CONSTRAINT machine_type_per EXCLUDE USING GIST (mtname WITH =,daterange(start_date,end_date) WITH &&);

The EXCLUDE PostgreSQL syntax allows us to specify many columns of different types and with a different operator for each one. && is the overlapping operator for date ranges, and = is the common equality operator for varchar. But as long as we hit enter PostgreSQL complains with a message:

ERROR:  data type character varying has no default operator class for access method "gist"
HINT:  You must specify an operator class for the index or define a default operator class for the data type.

What is lacking here is GiST opclass support for varchar. Provided we have successfully built and installed the btree_gist extension, we may proceed with creating the extension:

testdb=# create extension btree_gist ;
CREATE EXTENSION

And then re-trying to create the constraint and test it:

testdb=# alter table machine_type ADD CONSTRAINT machine_type_per EXCLUDE USING GIST (mtname WITH =,daterange(start_date,end_date) WITH &&);
ALTER TABLE
testdb=# insert into machine_type (mtname,mtvar,start_date,end_date) VALUES('Subaru EJ20','SH','2008-01-01','2013-01-01');
INSERT 0 1
testdb=# insert into machine_type (mtname,mtvar,start_date,end_date) VALUES('Subaru EJ20','SG','2002-01-01','2009-01-01');
ERROR:  conflicting key value violates exclusion constraint "machine_type_per"
DETAIL:  Key (mtname, daterange(start_date, end_date))=(Subaru EJ20, [2002-01-01,2009-01-01)) conflicts with existing key (mtname, daterange(start_date, end_date))=(Subaru EJ20, [2008-01-01,2013-01-01)).
testdb=# insert into machine_type (mtname,mtvar,start_date,end_date) VALUES('Subaru EJ20','SG','2002-01-01','2008-01-01');
INSERT 0 1
testdb=# insert into machine_type (mtname,mtvar,start_date,end_date) VALUES('Subaru EJ20','SJ','2013-01-01',null);
INSERT 0 1
testdb=# insert into machine_type (mtname,mtvar,start_date,end_date) VALUES('Subaru EJ20','SJ2','2018-01-01',null);
ERROR:  conflicting key value violates exclusion constraint "machine_type_per"
DETAIL:  Key (mtname, daterange(start_date, end_date))=(Subaru EJ20, [2018-01-01,)) conflicts with existing key (mtname, daterange(start_date, end_date))=(Subaru EJ20, [2013-01-01,)).

SP-GiST Indexes

SP-GiST which stands for space-partitioned GiST, like GiST, is an infrastructure that enables the development for many different strategies in the domain of non-balanced disk-based data structures. The default PgSQL distribution offers support for two-dimensional points, (any type) ranges, text and inet types. Like GiST, SP-GiST can be used in exclusion constraints, in a similar way to the example shown in the previous chapter.

GIN Indexes

GIN (Generalized Inverted Index) like GiST and SP-GiST can provide many indexing strategies. GIN is suited when we want to index columns of composite types. The default PostgreSQL distribution provides support for any array type, jsonb and full text search (tsvector). In contrib there are implementations of many other operator classes. Jsonb, a highly praised feature of PostgreSQL (and a relatively recent (9.4+) development) is relying on GIN for index support. Another common use of GIN is indexing for full text search. Full text search in PgSQL deserves an article on its own, so we’ll cover here only the indexing part. First let’s make some preparation to our table, by giving not null values to partdescr column and updating a single row with a meaningful value:

testdb=# update part set partdescr ='';
UPDATE 1000000
Time: 383407,114 ms (06:23,407)
testdb=# update part set partdescr = 'thermostat for the cooling system' where id=500000;
UPDATE 1
Time: 2,405 ms

Then we perform a text search on the newly updated column:

testdb=# select * from part where partdescr @@ 'thermostat';
   id   |   partno   |  partname   |             partdescr             | machine_id |  parttype  
--------+------------+-------------+-----------------------------------+------------+------------
 500000 | PNo:500000 | Part 500000 | thermostat for the cooling system |     500000 | Suspension
(1 row)

Time: 2015,690 ms (00:02,016)

This is quite slow, almost 2 seconds to bring our result. Now let’s try to create a GIN index on type tsvector, and repeat the query, using an index-friendly syntax:

testdb=# CREATE INDEX part_partdescr_idx ON part USING gin(to_tsvector('english',partdescr));
CREATE INDEX
Time: 1431,550 ms (00:01,432)
testdb=# select * from part where to_tsvector('english',partdescr) @@ to_tsquery('thermostat');
   id   |   partno   |  partname   |             partdescr             | machine_id |  parttype  
--------+------------+-------------+-----------------------------------+------------+------------
 500000 | PNo:500000 | Part 500000 | thermostat for the cooling system |     500000 | Suspension
(1 row)

Time: 0,952 ms

And we get a 2000-fold speed up. Also we may note the relatively short time that it took the index to be created. You may experiment with using GiST instead of GIN in the above example, and measure the performance of reads, writes and index creation for both access methods.

BRIN Indexes

BRIN (Block Range Index) is the newest addition to the PostgreSQL’s set of index types, since it was introduced in PostgreSQL 9.5, having only a few years as a standard core feature. BRIN works on very large tables by storing summary information for a set of pages called “Block Range”. BRIN Indexes are lossy (like GiST) and this requires both extra logic in PostgreSQL’s query executor, and also the need for extra maintenance. Let’s see BRIN in action:

testdb=# select count(*) from part where machine_id BETWEEN 5000 AND 10000;
 count
-------
  5001
(1 row)

Time: 100,376 ms
testdb=# create index part_machine_id_idx_brin ON part USING BRIN(machine_id);
CREATE INDEX
Time: 569,318 ms
testdb=# select count(*) from part where machine_id BETWEEN 5000 AND 10000;
 count
-------
  5001
(1 row)

Time: 5,461 ms

Here we see on average a ~ 18-fold speedup by the use of the BRIN index. However, BRIN’s real home is in the domain of big data, so we hope to test this relatively new technology in real world scenarios in the future.

How to Decode the PostgreSQL Error Logs

$
0
0

PostgreSQL error reporting follows a style guide aimed at providing the database administrator with the information required to efficiently troubleshoot issues. Error messages normally contain a short description, followed by some detailed information, and a hint, if applicable, suggesting the solution. There are other fine details, explained in the guide, such as the use of past or present tense to indicate if the error is temporary or permanent.

Types of Errors and Severity Levels

When reporting errors, PostgreSQL will also return an SQLSTATE error code, therefore errors are classified into several classes. When reviewing the list of classes, note that success and warning are also logged by PostgreSQL to the error log — that is because logging_collector, the PostgreSQL process responsible for logging, sends all messages to stderr by default.

When the logging collector has not been initialized, errors are logged to the system log. For example, when attempting to start the service following the package installation:

[root@omiday ~]# systemctl start postgresql
Job for postgresql.service failed because the control process exited with error code.
See "systemctl  status postgresql.service" and "journalctl  -xe" for details.
[root@omiday ~]# systemctl status postgresql
● postgresql.service - PostgreSQL database server
   Loaded: loaded (/usr/lib/systemd/system/postgresql.service; disabled; vendor preset: disabled)
   Active: failed (Result: exit-code) since Wed 2018-01-24 19:10:04 PST; 8s ago
Process: 1945 ExecStartPre=/usr/libexec/postgresql-check-db-dir postgresql (code=exited, status=1/FAILURE)

Jan 24 19:10:04 omiday.can.local systemd[1]: Starting PostgreSQL database server...
Jan 24 19:10:04 omiday.can.local postgresql-check-db-dir[1945]: Directory "/var/lib/pgsql/data" is missing or empty.
Jan 24 19:10:04 omiday.can.local postgresql-check-db-dir[1945]: Use "/usr/bin/postgresql-setup --initdb"
Jan 24 19:10:04 omiday.can.local postgresql-check-db-dir[1945]: to initialize the database cluster.
Jan 24 19:10:04 omiday.can.local postgresql-check-db-dir[1945]: See /usr/share/doc/postgresql/README.rpm-dist for more information.
Jan 24 19:10:04 omiday.can.local systemd[1]: postgresql.service: Control process exited, code=exited status=1
Jan 24 19:10:04 omiday.can.local systemd[1]: Failed to start PostgreSQL database server.
Jan 24 19:10:04 omiday.can.local systemd[1]: postgresql.service: Unit entered failed state.
Jan 24 19:10:04 omiday.can.local systemd[1]: postgresql.service: Failed with result 'exit-code'.

When returning error messages to clients, and therefore logging to error log, messages are logged with a severity level that is controlled using the client_min_messages parameter. Logging to server log files is controlled by the parameter log_min_messages, while log_min_error_statement enables logging of SQL statements that cause an error of a specific severity level.

PostgreSQL can be configured to log at the following severity levels:

  • PANIC: All database sessions are aborted. This is a critical situation that affects all clients.
  • FATAL: The current session is aborted due to an error. The client may retry. Other databases in the cluster are not affected.
  • LOG: Normal operation messages.
  • ERROR: Failure to execute a command. This is a permanent error.
  • WARNING: An event that, while not preventing the command to complete, may lead to failures if not addressed. Monitoring for warnings is a good practice in early detection of issues on both the server and application side.
  • NOTICE: Information that clients can use to improve their code.
  • INFO: Logs explicitly requested by clients.
  • DEBUG1..DEBUG5: Developer information.

Note: Higher level messages include messages from lower levels i.e. setting the logging level to LOG, will instruct PostgreSQL to also log FATAL and PANIC messages.

Common Errors and How to Fix Them

What follows is a non exhaustive list:

Error Message

psql: could not connect to server: No such file or directory

Cause

[root@omiday ~]# psql -U postgres
psql: could not connect to server: No such file or directory
        Is the server running locally and accepting
        connections on Unix domain socket "/var/run/postgresql/.s.PGSQL.5432"?

Resolution

Verify that the PostgreSQL service is running using operating system tools (ps, netstat, ss, systemctl) or check for the presence of postmaster.pid in the data directory.

Error Message

psql: FATAL:  Peer authentication failed for user "postgres"

Cause

[root@omiday ~]# psql -U postgres
psql: FATAL:  Peer authentication failed for user "postgres"

Resolution

The log file will contain a more detailed message to that effect:

LOG:  provided user name (postgres) and authenticated user name (root) do not match
FATAL:  Peer authentication failed for user "postgres"
DETAIL:  Connection  matched  pg_hba.conf  line  80:  "local  all  all  peer"

Follow these steps:

  1. Log in as the postgres user:

    [root@omiday ~]# su - postgres
    [postgres@omiday ~]$ psql
    psql (9.6.6)
    Type "help" for help.
    
    postgres=#
  2. Make the following change to pg_hba.conf that will allow the root user to log in without a password:

    --- a/var/lib/pgsql/data/pg_hba.conf
    +++ b/var/lib/pgsql/data/pg_hba.conf
    @@ -77,6 +77,7 @@
    # TYPE  DATABASE        USER            ADDRESS                 METHOD
    
    # "local" is for Unix domain socket connections only
    +local   all             postgres                                trust
    local   all             all                                     peer
    # IPv4 local connections:
    host    all             all             127.0.0.1/32            ident
  3. Reload the service and test:

    [root@omiday ~]# psql -U postgres
    psql (9.6.6)
    Type "help" for help.
    
    postgres=#

Error Message

psql: could not connect to server: Connection refused
        Is the server running on host "192.168.0.11" and accepting
        TCP/IP connections on port 5432?

Cause

A client attempted a connection to the public IP address.

Note: This is an error returned to the client, in the example above psql. In case of a web application check the web server error log.

Resolution

Configure the service to listen on the public IP address:

Note: As a best practice use alter system rather than editing postgresql.conf.

postgres=# alter system set listen_addresses TO 'localhost,192.168.0.11';
ALTER SYSTEM

The alter system command has modified the postgresql.auto.conf as shown below:

--- a/var/lib/pgsql/data/postgresql.auto.conf
+++ b/var/lib/pgsql/data/postgresql.auto.conf
@@ -1,2 +1,3 @@
# Do not edit this file manually!
-# It will be overwritten by the ALTER SYSTEM command.
+# It will be overwritten by ALTER SYSTEM command.
+listen_addresses = 'localhost,192.168.0.11'

Restart the service and test:

[root@omiday ~]# psql -U webuser -h 192.168.0.11 webapp
psql: FATAL:  no pg_hba.conf entry for host "192.168.0.11", user "webuser", database "webapp", SSL off

We’ll address this error in the next topic.

Error Message

psql: FATAL:  no pg_hba.conf entry for host "192.168.0.11", user "webuser", database "webapp", SSL off

Cause

PostgreSQL service running on the IP address 192.168.0.11 is not configured to allow the user webuser to connect to the database webapp.

Resolution

Modify the access file pg_hba.conf to allow the connection:

--- a/var/lib/pgsql/data/pg_hba.conf
+++ b/var/lib/pgsql/data/pg_hba.conf
@@ -81,6 +81,7 @@
local   all             postgres                                trust
local   all             all                                     peer
# IPv4 local connections:
host    all             webuser         127.0.0.1/32            md5
+host    all             webuser         192.168.0.11/32         md5
host    all             all             127.0.0.1/32            ident
# IPv6 local connections:
host    all             webuser         ::1/128                 md5

Reload the service and test:

[root@omiday ~]# psql -U webuser -h 192.168.0.11 webapp
Password for user webuser:
psql (9.6.6)
Type "help" for help.

webapp=> \c
You are now connected to database "webapp" as user "webuser".

Error Message

ERROR:  syntax error at or near "grant"

Cause

Grant is one of the PostgreSQL reserved keywords

Resolution

Reserved keywords must be quoted:

webapp=> create table "grant" (id numeric);
CREATE TABLE
And verify:
webapp=> \d "grant"
     Table "public.grant"
 Column |  Type   | Modifiers
--------+---------+-----------
 id     | numeric |

webapp=>

Error Message

ERROR:  cannot drop table cust because other objects depend on it

Cause

A client attempted removing the table cust that has child tables.

Resolution

Review HINT in the log file:

ERROR:  cannot drop table cust because other objects depend on it
DETAIL:  table cust_region_1 depends on table cust
HINT:  Use DROP ... CASCADE to drop the dependent objects too.
STATEMENT:  drop table cust;

Error Message

ERROR:  invalid input syntax for type numeric: "b" at character 26

Cause

The log file reveals an attempt to insert a value that doesn’t match the column type:

ERROR:  invalid input syntax for type numeric: "b" at character 26
STATEMENT:  insert into cust values ('b', 2);

Resolution

This is an application side error that must be corrected by developers, or if it was initiated by a client such as a DBA running psql. No action is required by the production DBA, since the full error message was also returned to the client.

ClusterControl
Single Console for Your Entire Database Infrastructure
Find out what else is new in ClusterControl

Reviewing and Monitoring Logs

The most simple option is configuring PostgreSQL to use syslog via the log_destination parameter so logs can be shipped to your favorite centralized logging system (e.g. rsyslog) and then further processed there for alerting on specific error conditions.

Another tool, that requires a close to none setup is tail_n_mail, which works in combination with the cron daemon.

Yet another tool in this list is pgBadger that comes with a rich set of options for reporting, visualizing and analyzing not only the PostgreSQL log files but also the information logged by the statistics collector.

Moving up on the complexity scale, organization can benefit from investing the time and effort for setting up an ELK stack, which uses the Filebeat PostgreSQL module to generate alerts and reports.

Conclusion

Reviewing the error logs, being notified on critical issues, and having a versatile log management system that aids in troubleshooting is important in maintaining a healthy database environment. Fortunately, PostgreSQL provides a rich error management framework, reflected in the large variety of available products to choose from. The criteria for selecting the ones that best suit a specific environment must include not only the product features but also the technical expertise required.

Viewing all 350 articles
Browse latest View live