Quantcast
Channel: Severalnines - PostgreSQL
Viewing all 350 articles
Browse latest View live

Upgrading Your Database to PostgreSQL Version 10 - What You Should Know

$
0
0

As more and more posts on PostgreSQL 11 appear on the web, the more outdated you may feel when using Postgres 9. Although the PostgreSQL 10 version release only happened just months ago, people are already are talking about the next version. Things are moving, so you don’t want to be left behind. In this blog we will discuss what you need to know to upgrade to the latest version, Postgres 10.

Upgrade Options

The first thing you should be aware of before you start is that there are several ways of doing the upgrade:

  1. Traditional pg_dumpall(pg_dump) / pg_restore(psql)
  2. Traditional pg_upgrade
  3. Trigger based replication (Slony, self-written)
  4. Using pglogical replication

Why is there such a variety? Because each has a different history, requiring different efforts to be set up and offering different services. Let's look closer at each of them.

Traditional Dump/Restore

pg_dump t > /tmp/f
psql -p 5433 -f /tmp/f

Traditional dump/restore takes the longest time to complete and yet it is often a popular choice for those who can afford the downtime. First, it's as easy as taking a logical backup and restoring it to a new, higher version of the database. You could say it's not an upgrade, really, as you "import" your data to a "new structure". As a result you will end up with two setups - one old (lower version) and the newly upgraded one. If the restoration process finishes without error, you are pretty much there. If not, you have to modify the existing old cluster to eliminate any errors and start the process over again.

If you use psql for import, you might also need to create some preload scripts yourself to execute on the new setup prior to migration. For example, you would want to pg_dumpall -g to get a list of needed roles to prepare in the new setup, or the opposite run pg_dump -x to skip permissions from old one. This process is pretty simple on small databases, the complexity grows with the size and complexity of your db structure and depends on what features you have setup. Basically for this method to be successful, you need to keep trying and fixing until the upgrade is successful.

The advantages to using this method include...

  • While you may spend a long time with one backup you made - the load on the old server is as small as taking one backup.
  • This method is mostly just a backup-restore sequence (potentially with some spells, songs and drumming)
  • Using this method is the oldest way to upgrade and has been verified by MANY people

When you finally complete the upgrade you either have to shut down the old server or accept some data loss (or alternatively replay the DML that happened onto the old server while restoring a backup to the new server). And the time spent doing that is relative to the size of your database.

You can, of course, start "using" a new database before restore has finished (especially before all indexes are built - often the most time it takes is for indexes). But nevertheless such downtime is often unacceptable.

Traditional pg_upgrade

MacBook-Air:~ vao$ /usr/local/Cellar/postgresql/10.2/bin/initdb -D tl0 >/tmp/suppressing_to_save_screen_space_read_it

WARNING: enabling "trust" authentication for local connections
You can change this by editing pg_hba.conf or using the option -A, or
--auth-local and --auth-host, the next time you run initdb.
MacBook-Air:~ vao$ /usr/local/Cellar/postgresql/10.2/bin/pg_upgrade -b /usr/local/Cellar/postgresql/9.5.3/bin -B /usr/local/Cellar/postgresql/10.2/bin -d t -D tl0 | tail
Creating script to delete old cluster                        ok

Upgrade Complete
----------------
Optimizer statistics are not transferred by pg_upgrade so,
once you start the new server, consider running:
    ./analyze_new_cluster.sh

Running this script will delete the old cluster’s data files:
    ./delete_old_cluster.sh

Traditional pg_upgrade was created to shorten the time it takes to upgrade to a major version. Depending on the amount of relations you have it can be as fast as minutes (seconds in ridiculous cases, like one table database and hours in the "opposite cases") especially with --link argument.

The preparation sequence slightly differs from first upgrade method. In order to mock up the upgrade and thus to check if it's possible, you should build streaming replication or recover a standby server from WALs. Why is this so complicated? You want to be sure to test the upgrade on as-close-in-state-database as you had originally. "Binary" replication or PITR will help us here. After you finish the recovery and recovery_target_action = promote (PITR) or promoted the newly built slave (pg_ctl promote or place a trigger file) (streaming replication) you can then try to run pg_upgrade. Checking the pg_upgrade_internal.log will give you an idea if the process was successful or not. Furthermore, you have the same try-and-fix approach as the previous method. You save the actions taken against the test database in a script, until you successfully pg_upgrade it. In addition, you can destroy no longer needed test upgraded database, run thensaved script to prepare the original database for perform the upgrade.

The advantages to using this method include…

  • Shorter downtime than logical backup/restore
  • A neat process - pg_upgrade upgrades the original database with existing data and structure
  • Has been used used a lot in past and still would be the preference for the most DBAs running version below 9.4 (which allows using pglogical)

The disadvantages of using this method include…

  • Requires downtime

Trigger Based Replication

Assuming version 10 is on port 5433 and has the same table prepared:

db=# create server upgrade_to_10 foreign data wrapper postgres_fdw options (port '5433', dbname 'dbl0');
CREATE SERVER
Time: 9.135 ms
db=# create user mapping for vao SERVER upgrade_to_10 options (user 'vao');
CREATE USER MAPPING
Time: 8.741 ms
db=# create foreign table rl0 (pk int, t text) server upgrade_to_10 options (table_name 'r');
CREATE FOREIGN TABLE
Time: 9.358 ms

This is an extremely simplistic fn() and trigger for very basic logical replication. Such approach is so primitive it won’t work with foreign keys, but the code is short:

db=# create or replace function tf() returns trigger as $$
begin
 if TG_0P = 'INSERT' then
   insert into r10 select NEW.*;
 elseif TG_0P = 'UPDATE' then
   delete from rl0 where pk = NEW.pk;
   insert into rl0 select NEW.*;
 elseif TG_0P = 'DELETE' then
   delete from rl0 where pk = OLD.pk;
 end if;
return case when TG_0P in ('INSERT','UPDATE') then NEW else OLD end;
end;
SS language plpgsql;
CREATE FUNCTION
Time: 8.531 ms
db=# create trigger t before insert or update or delete on r for each row execute procedure tf(); CREATE TRIGGER
Time: 8.813 ms

Example:

db=# insert into r(t) select chr(g) from generate_series(70,75) g;
INSERT 0 6
Time: 12.621 ms
db=# update r set t = 'updated' where pk=2;
UPDATE 1
Time: 10.398 ms
db=# delete from r where pk=1;
DELETE 1
Time: 9.634 ms
db=# select * from r;
 pk |    t
----+---------
  3 | H
  4 | I
  5 | J
  6 | K
  2 | updated
(5 rows)

Time: 9.026 ms
db=# select * from rl0;
 pk |    t
----+---------
  3 | H
  4 | I
  5 | J
  6 | K
  2 | updated
(5 rows)

Time: 1.201 ms

Lastly, checking that we replicate to a different database:

db=# select *,current_setting('port') from dblink('upgrade.to.lO','select setting from pg_settings where name=$$port$$') as t(setting_10 text);
 setting_10 | currerrt.setting
------------+------------------
 5433       | 5432
(l row)

Time: 23.633 ms

I would call this method the most exotic. Both for the fact that with streaming replication and later with pglogical, the use of trigger based replication becomes less popular. It has a higher load on the master, increased complexity during setup and a lack of well structured documentation. There's no preparation (as such) of the process here, as you just want to setup Slony on different major versions.

The advantages of using this method include…

  • No backups need to be taken and no downtime required (especially you are behind some pgbouncer or haproxy).

The disadvantages of using this method include…

  • High Complexity of setup
  • Lack of structured documentation
  • Not very popular - less user cases to study (and share)

Along the same lines, self written trigger replication is another possible way to upgrade. While the idea is the same (you spin up a fresh higher version database and set up triggers on lower version to send modified data to it), the self written set up will be clear to you. You won't have any need for support, and thus potentially use less resources when running it. Of course, for the same reason you probably will end up with some features missing or not working as expected. If you have several tables to move to new versions, such an option will probably take you less time and, if done well, might be less resource consuming. As a bonus you can combine some ETL transformations with the upgrade, switching over to a new version without downtime.

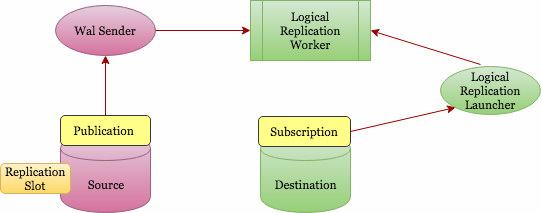
Logical Replication with pglogical

This is a very promising new way of upgrading Postgres. The idea is to set up logical replication between different major versions and literally have a parallel, higher (or lower) version database running the same data. When you are ready, you just switch connections with your application from old to new.

The advantages of using this method include…

  • Basically no downtime
  • Extremely promising feature, much less effort than trigger based replication

The disadvantages of using this method include…

  • Still highly complex to setup (especially for older versions)
  • Lack of structured documentation
  • Not very popular - less user cases to study (and share)

Both the trigger-based and pglogical replication major version migrations can be used to downgrade the version (up to some reasonable value of course, e.g., pglogical is available from 9.4 only and trigger replication becomes harder and harder to set up as the version you want to downgrade to gets older).

Actions to be Taken Before the Upgrade

Actions to be Taken After the Upgrade

  • Consult pg_upgrade_server.log (if you used pg_upgrade)
  • Run analyze on upgraded databases (optional, as it would be done by autovacuum, but you can choose what relations should be analyzed first if you do it yourself)
  • Prewarm popular pages (optional, but could boost performance at the beginning)

Conclusion

Here are some general notes that are good to know before you decide to go to PostgreSQL version 10…

  • pg_sequences were introduced, changing the behaviour of previously popular SELECT * FROM sequence_name - now only last_value | log_cnt | is_called are returned, hiding from you "initial properties" (adjust any code that relies on changed behaviour)
  • pg_basebackup streams WAL by default. After the upgrade you might need to modify your scripts (option -x removed)
  • All pg_ctl actions are waiting for completion. Previously you had to add -w to avoid trying to connect to the database straight after pg_ctl start. Thus if you still want to use "async" start or stop, you have to explicitly mark it with -W. You might need to adjust your scripts so they behave as intended.
  • All scripts for archiving WALs or monitoring/controlling streaming replication or PITR need to be reviewed, to adjust them to changed xlog names. Eg. select * from pg_is_xlog_replay_paused() will no longer show you the state of slave WALs replay - you have to use select * from pg_is_wal_replay_paused() instead. Also cp /blah/pg_xlog/* needs to be changed to /blah/pg_wal/* and so on basically for all occurrences of pg_xlog. The reason behind such a massive, non backward compatible change is to address the case when a newby removes write-ahead-logs to "clean some space" by removing logs, and loses the database.
  • Adjust scripts using pg_stat_replication for new names (location changed to lsn)
  • Adjust queries with set returning functions if needed
  • If you used pglogical as extension before version 10, you might need to adjust pg_hba.conf changing value between "columns"
  • Adjust scripts for a new name of pg_log which is log, so something like find /pg_data/pg_log/postgresql-*  -mmin +$((60*48)) -type f -exec bash /blah/moveto.s3.sh {} \; would work. Of course you can create a symbolic link instead, but action would need to be taken to find logs in default location. Another small change to defaults is log_line_prefix - if your regular expression depended on a certain format, you need to adjust it.
  • If you were still using unencrypted passwords in your Postgres databases, this release complete removes it. So it's time to sort things out for those who relied on --unencrypted...
  • The rest of the incompatible changes with previous releases are either too fresh to be referenced in lots of code (min_parallel_relation_size) or too ancient (external tsearch2) or are too exotic (removal of floating-point timestamps support in build), so we will skip them. Of course they are listed on the release page.
  • As it was with 9.5 to 9.6, you might need to adjust your scripts for querying pg_stat_activity (one new column and new possible values)
  • If you were saving/analyzing vacuum verbose output, you might need to adjust your code
  • Also you might want to take a look at the new partitioning implementation - you might want to refactor your existing "set" to comply with new "standards"
  • check timeline (will be reset for the new database if you pg_upgrade)

Apart of these steps that you have to know to upgrade to 10, there are plenty of things that make this release a highly anticipated one. Please read the section on changes in the release notes or depesz blog.


How to Secure your PostgreSQL Database - 10 Tips

$
0
0

Once you have finished the installation process of your PostgreSQL database server it is necessary to protect it before going into production. In this post, we will show you how to harden the security around your database to keep your data safe and secure.

1. Client Authentication Control

When installing PostgreSQL a file named pg_hba.conf is created in the database cluster's data directory. This file controls client authentication.

From the official postgresql documentation we can define the pg_hba.conf file as a set of records, one per line, where each record specifies a connection type, a client IP address range (if relevant for the connection type), a database name, a user name, and the authentication method to be used for connections matching these parameters.The first record with a matching connection type, client address, requested database, and user name is used to perform authentication.

So the general format will be something like this:

# TYPE  DATABASE        USER            ADDRESS                 METHOD

An example of configuration can be as follows:

# Allow any user from any host with IP address 192.168.93.x to connect
# to database "postgres" as the same user name that ident reports for
# the connection (typically the operating system user name).
#
# TYPE  DATABASE        USER            ADDRESS                 METHOD
 host     postgres              all             192.168.93.0/24         ident
# Reject any user from any host with IP address 192.168.94.x to connect
# to database "postgres
# TYPE  DATABASE        USER            ADDRESS                 METHOD
 host     postgres              all             192.168.94.0/24         reject

There are a lot of combinations you can make to refine the rules (the official documentation describes each option in detail and has some great examples), but remember to avoid rules that are too permissive, such as allowing access for lines using DATABASE all or ADDRESS 0.0.0.0/0.

For ensuring security, even if you are forgetting to add a rule, you can add the following row at the bottom:

# TYPE  DATABASE        USER            ADDRESS                 METHOD
 host     all              all             0.0.0.0/0         reject

As the file is read from top to bottom to find matching rules, in this way you ensure that for allowing permission you will need to explicitly add the matching rule above.

2. Server Configuration

There are some parameters on the postgresql.conf that we can modify to enhance security.

You can use the parameter listen_address to control which ips will be allowed to connect to the server. Here is a good practice to allow connections only from the known ips or your network, and avoid general values like “*”,”0.0.0.0:0” or “::”, which will tell PostgreSQL to accept connection from any IP.

Changing the port that postgresql will listen on (by default 5432) is also an option. You can do this by modifying the value of the port parameter.

Parameters such as work_mem, maintenance_work_mem, temp_buffer , max_prepared_transactions, temp_file_limit are important to keep in mind in case you have a denial of service attack. These are statement/session parameters that can be set at different levels (db, user, session), so managing these wisely can help us minimize the impact of the attack.

3. User and Role Management

The golden rule for security regarding user management is to grant users the minimum amount of access they need.

Managing this is not always easy and it can get really messy if not done well from the beginning.

A good way of keeping the privileges under control is to use the role, group, user strategy.

In postgresql everything is considered a role, but we are going to make some changes to this.

In this strategy you will create three different types or roles:

  • role role (identified by prefix r_)
  • group role (identified by prefix g_)
  • user role (generally personal or application names)

The roles (r_ roles) will be the ones having the privileges over the objects. The group roles ( g_ roles ) will be granted with the r_ roles , so they will be a collection of r_ roles. And finally, the user roles will be granted with one or more group roles and will be the ones with the login privilege.

Let's show an example of this. We will create a read only group for the example_schema and then grant it to a user:

We create the read only role and grant the object privileges to it

CREATE ROLE r_example_ro NOSUPERUSER INHERIT NOCREATEDB NOCREATEROLE NOREPLICATION;
GRANT USAGE ON SCHEMA example to r_example_ro;
GRANT SELECT ON ALL TABLES IN SCHEMA example to r_example_ro;
ALTER DEFAULT PRIVILEGES IN SCHEMA example GRANT SELECT ON TABLES TO r_example_ro;

We create the read only group and grant the role to that group

CREATE ROLE g_example_ro NOSUPERUSER INHERIT NOCREATEDB NOCREATEROLE NOREPLICATION';
GRANT r_example_ro to g_example_ro;

We create the app_user role and make it "join" the read only group

CREATE ROLE app_user WITH LOGIN ;
ALTER ROLE app_user WITH PASSWORD 'somePassword' ;
ALTER ROLE app_user VALID UNTIL 'infinity' ;
GRANT g_example_ro TO app_user;

Using this method you can manage the granularity of the privileges and you can easily grant and revoke groups of access to the users. Remember to only grant object privileges to the roles instead of doing it directly for the users and to grant the login privilege only to the users.

This is a good practice to explicitly revoke public privileges on the objects, like revoke the public access to a specific database and only grant it through a role.

REVOKE CONNECT ON my_database FROM PUBLIC;
GRANT CONNECT ON my_database TO r_example_ro;

Restrict SUPERUSER access, allow superuser connections only from localhost/unix domain.

Use specific users for different purposes, like specific app users or backup users, and limit the connections for that user only from the required ips.

4. Super User Management

Maintaining a strong password policy is a must for keeping your databases safe and avoid the passwords hacks. For a strong policy use preferentially special characters, numbers, uppercase and lowercase characters and have at least 10 characters.

There are also external authentication tools, like LDAP or PAM, that can help you ensure your password expiration and reuse policy, and also handle account locking on authentication errors.

5. Data Encryption (on connection ssl)

PostgreSQL has native support for using SSL connections to encrypt client/server communications for increased security. SSL (Secure Sockets Layer) is the standard security technology for establishing an encrypted link between a web server and a browser. This link ensures that all data passed between the web server and browsers remain private and integral.

As postgresql clients sends queries in plain-text and data is also sent unencrypted, it is vulnerable to network spoofing.

You can enable SSL by setting the ssl parameter to on in postgresql.conf.

The server will listen for both normal and SSL connections on the same TCP port, and will negotiate with any connecting client on whether to use SSL. By default, this is at the client's option, but you have the option to setup the server to require use of SSL for some or all connections using the pg_hba config file described above.

6. Data Encryption at Rest (pg_crypto)

There are two basic kinds of encryption, one way and two way. In one way you don't ever care about decrypting the data into readable form, but you just want to verify the user knows what the underlying secret text is. This is normally used for passwords. In two way encryption, you want the ability to encrypt data as well as allow authorized users to decrypt it into a meaningful form. Data such as credit cards and SSNs would fall in this category.

For one way encryption, the crypt function packaged in pgcrypto provides an added level of security above the md5 way. The reason is that with md5, you can tell who has the same password because there is no salt (In cryptography, a salt is random data that is used as an additional input to a one-way function that "hashes" data, a password or passphrase), so all people with the same password will have the same encoded md5 string. With crypt, they will be different.

For data that you care about retrieving, you don't want to know if the two pieces of information are the same, but you don't know that information, and you want only authorized users to be able to retrieve it. Pgcrypto provides several ways of accomplishing this, so for further reading on how to use it you can check the oficial postgresql documentation on https://www.postgresql.org/docs/current/static/pgcrypto.html.

7. Logging

Postgresql provides a wide variety of config parameters for controlling what, when, and where to log.

You can enable session connection/disconnections, long running queries, temp file sizes and so on. This can help you get a better knowledge of your workload in order to identify odd behaviours. You can get all the options for logging on the following link https://www.postgresql.org/docs/9.6/static/runtime-config-logging.html

For more detailed information on your workload, you can enable the pg_stat_statements module, that provides a means for tracking execution statistics of all SQL statements executed by a server. There are some security tools that can ingest the data from this table and will generate an sql whitelist, in order to help you identify queries not following the expected patterns.

For more information https://www.postgresql.org/docs/9.6/static/pgstatstatements.html.

ClusterControl
Single Console for Your Entire Database Infrastructure
Find out what else is new in ClusterControl

8. Auditing

The PostgreSQL Audit Extension (pgAudit) provides detailed session and/or object audit logging via the standard PostgreSQL logging facility.

Basic statement logging can be provided by the standard logging facility with log_statement = all. This is acceptable for monitoring and other usages but does not provide the level of detail generally required for an audit. It is not enough to have a list of all the operations performed against the database. It must also be possible to find particular statements that are of interest to an auditor. The standard logging facility shows what the user requested, while pgAudit focuses on the details of what happened while the database was satisfying the request.

9. Patching

Check PostgreSQL's security information page regularly and frequently for critical security updates and patches.

Keep in mind that OS or libraries security bugs can also lead to a database leak, so ensure you keeping the patching for these up to date.

ClusterControl provides an operational report that gives you this information and will execute the patches and upgrades for you.

10. Know Your Workload (pg_stats_statement)

In addition to the SQL-standard privilege system available through GRANT, tables can have row security policies that restrict, on a per-user basis, which rows can be returned by normal queries or inserted, updated, or deleted by data modification commands. This feature is also known as Row-Level Security.

When row security is enabled on a table all normal access to the table for selecting rows or modifying rows must be allowed by a row security policy.

Here is a simple example how to create a policy on the account relation to allow only members of the managers role to access rows, and only rows of their accounts:

CREATE TABLE accounts (manager text, company text, contact_email text);
ALTER TABLE accounts ENABLE ROW LEVEL SECURITY;
CREATE POLICY account_managers ON accounts TO managers USING (manager = current_user);

You can get more information on this feature on the oficial postgresql documentation https://www.postgresql.org/docs/9.6/static/ddl-rowsecurity.html

If you would like to learn more, here are some resources that can help you to better strengthen your database security…

Conclusion

If you follow the tips above your server will be safer, but this does not mean that it will be unbreakable.

For your own security we recommend that you use a security test tool like Nessus, to know what your main vulnerabilities are and try to solve them.

You can also monitor your database with ClusterControl. With this you can see in real time what's happening inside your database and analyze it.

Setting Up an Optimal Environment for PostgreSQL

$
0
0

Welcome to PostgreSQL, a powerful open source database system that can host anything from a few megabytes of customer data for a small-town-business, to hundreds of terabytes of ‘big data’ for multinational corporations. Regardless of the application, it’s likely that some setup and configuration help will be needed to get the database ready for action.

When a new server is installed, PostgreSQL’ s settings are very minimum as they are designed to run on the least amount of hardware possible. However they are very rarely optimal. Here, we will go over a basic setup for new projects, and how to set PostgreSQL up to run the most optimally on new projects.

Hosting

On-Premise Hosting

With an on-premise database, the best option is for a bare metal host, as Virtual Machines generally perform slower unless we’re talking about high end enterprise level VM’s. This also allows for tighter control over CPU, Memory, and Disk setups. This however comes with the need to have an expert on hand (or contract) to do server maintenance.

Cloud

Hosting a database in the cloud can be wonderful in some aspects, or a nightmare in others. Unless the cloud platform chosen is highly optimized (which generally means higher price), it may have trouble with higher load environments. Keep an eye out for whether or not the cloud server is shared or dedicated (dedicated allowing full performance from the server for the application), as well as the level of IOPS (Input/output Operations Per Second) provided by a cloud server. When (or if) the application grows to the point that the majority of data cannot be stored in memory, disk access speed is crucial.

General Host Setup

The main pillars needed to reliably set up PostgreSQL are based on the CPU, Memory, and Disk abilities of the host. Depending on the applications needs, a sufficient host as well as a well-tuned PostgreSQL configuration will have an amazing impact on the performance of the database system.

Choosing an Operating System

PostgreSQL can be compiled on most Unix-like operating systems, as well as Windows. However performance on Windows is not even comparable to a Unix-like system, so unless it’s for a small throw away project, sticking to an established Unix-like system will be the way to go. For this discussion, we’ll stick to Linux based systems.

The seemingly highest used Linux distribution used for hosting PostgreSQL is a Red Hat based system, such as CentOS or Scientific Linux, or even Red Hat itself. Since Red Hat and CentOS focus on stability and performance, the community behind these projects work hard to make sure important applications, such as databases, are on the most secure and most reliable build of Linux possible.

NOTE: Linux has a range of kernel versions that are not optimal for running PostgreSQL, so they are highly suggested to be avoided if possible (especially on applications where peak performance is the utmost importance). Benchmarks have shown that the number of transactions per second drop from kernel version 3.4 – 3.10, but recovers and significantly improves in kernel 3.12. This unfortunately rules out using CentOS 7 if going the CentOS route. CentOS 6 is still a valid and supported version of the Operating System, and CentOS 8 is expected to be released before 6 becomes unsupported.

Installation

Installation can be done either by source, or using repositories maintained by either the distribution of Linux chosen, or better yet, the PostgreSQL Global Development Group (PGDG), which maintains repositories for Red Hat based systems (Red Hat, Scientific Linux, CentOS, Amazon Linux AMI, Oracle Enterprise Linux, and Fedora), as well as packages for Debian and Ubuntu. Using the PGDG packages will ensure updates to PostgreSQL are available for update upon release, rather than waiting for the Linux distribution’s built in repositories to approve and provide them.

CPU

These days, it’s not hard to have multiple cores available for a database host. PostgreSQL itself has only recently started adding multi-threading capabilities on the query level, and will be getting much better in the years to come. But even without these new and upcoming improvements, PostgreSQL itself spawns new threads for each connection to the database by a client. These threads will essentially use a core when active, so number of cores required will depend on the level of needed concurrent connections and concurrent queries.

A good baseline to start out with is a 4 core system for a small application. Assuming applications do a dance between executing queries and sleeping, a 4 core system can handle a couple dozen connections before being overloaded. Adding more cores will help scale with an increasing workload. It’s not uncommon for very large PostgreSQL databases to have 48+ cores to serve many hundreds of connections.

Tuning Tips: Even if hyper-threading is available, transactions per second are generally higher when hyper-threading is disabled. For database queries that aren’t too complex, but higher in frequency, more cores is more important than faster cores.

Memory

Memory is an extremely important aspect for PostgreSQL’s overall performance. The main setting for PostgreSQL in terms of memory is shared_buffers, which is a chunk of memory allocated directly to the PostgreSQL server for data caching. The higher the likelihood of the needed data is living in memory, the quicker queries return, and quicker queries mean a more efficient CPU core setup as discussed in the previous section.

Queries also, at times, need memory to perform sorting operations on data before it’s returned to the client. This either uses additional ad-hoc memory (separate from shared_buffers), or temporary files on disk, which is much slower.

Tuning Tips: A basic starting point for setting shared_buffers is to set it to 1/4th the value of available system ram. This allows the operating system to also do its own caching of data, as well as any running processes other than the database itself.

Increasing work_mem can speed up sorting operations, however increasing it too much can force the host to run out of memory all together, as the value set can be partially or fully issued multiple times per query. If multiple queries request multiple blocks of memory for sorting, it can quickly add up to more memory than what is available on the host. Keep it low, and raise it slowly until performance is where desired.

Using the ‘free’ command (such as ‘free -h’), set effective_cache_size to a the sum of memory that’s free and cached. This lets the query planner know the level of OS caching may be available, and run better query plans.

Disk

Disk performance can be one of the more important things to consider when setting up a system. Input / Output speeds are important for large data loads, or fetching huge amounts of data to be processed. It also determines how quickly PostgreSQL can sync memory with disk to keep the memory pool optimal.

Some preparation in disks can help instantly improve potential performance, as well as future proof the database system for growth.

  • Separate disks

    A fresh install of PostgreSQL will create the cluster’s data directory somewhere on the main (and possibly only) available drive on the system.

    A basic setup using more drives would be adding a separate drive (or set of drives via RAID). It has the benefit of having all database related data transfer operating on a different I/O channel from the main operating system. It also allows the database to grow without fear of insufficient space causing issues and errors elsewhere in the operating system.

    For databases with an extreme amount of activity, the PostgreSQL Transaction Log (xlog) directory can be placed on yet another drive, separating more heavy I/O to another channel away from the main OS as well as the main data directory. This is an advanced measure that helps squeeze more performance out of a system, that may otherwise be near its limits.

  • Using RAID

    Setting up RAID for the database drives not only protects from data loss, it can also improve performance if using the right RAID configuration. RAID 1 or 10 are generally thought to be the best, and 10 offers parity and overall speed. RAID 5, however, while having higher levels of redundancy, suffers from significant performance decrease due to the way it spreads data around multiple disks. Plan out the best available option with plenty of space for data growth, and this will be a configuration that won’t need to be changed often, if at all.

  • Using SSD

    Solid State Drives are wonderful for performance, and if they meet the budget, enterprise SSD’s can make heavy data processing workloads night and day faster. Smaller to medium databases with smaller to medium workloads may be overkill, but when fighting for the smallest percentage increase on large applications, SSD can be that silver bullet.

Tuning Tips: Chose a drive setup that is best for the application at hand, and has plenty of space to grow with time as the data increases.

If using a SSD, setting random_page_cost to 1.5 or 2 (the default is 4) will be beneficial to the query planner, since random data fetching is much quicker than seen on spinning disks.

Initial Configuration Settings

When setting up PostgreSQL for the first time, there’s a handful of configuration settings that can be easily changed based on the power of the host. As the application queries the database over time, specific tuning can be done based on the application’s needs. However that will be the topic for a separate tuning blog.

Memory Settings

shared_buffers: Set to 1/4th of the system memory. If the system has less than 1 GB of total memory, set to ~ 1/8th of total system memory

work_mem: The default is 4MB, and may even be plenty for the application in question. But if temp files are being created often, and those files are fairly small (tens of megabytes), it might be worth upping this setting. A conservative entry level setting can be (1/4th system memory / max_connections). This setting depends highly on the actual behavior and frequency of queries to the database, so should be only increased with caution. Be ready to reduce it back to previous levels if issues occur.

effective_cache_size: Set to the sum of memory that’s free and cached reported by the ‘free’ command.

Checkpoint Settings

For PostgreSQL 9.4 and below:
checkpoint_segments: A number of checkpoint segments (16 megabytes each) to give the Write Ahead Log system. The default is 3, and can safely be increased to 64 for even small databases.

For PostgreSQL 9.5 and above:
max_wal_size: This replaced checkpoint_segments as a setting. The default is 1GB, and can remain here until needing further changes.

Security

listen_address: This setting determines what personal IP addresses / Network Cards to listen to connections on. In a simple setup, there will likely be only one, while more advanced networks may have multiple cards to connect to multiple networks. * Signifies listen to everything. However, if the application accessing the database is to live on the same host as the database itself, keeping it as ‘localhost’ is sufficient.

Logging

Some basic logging settings that won’t overload the logs are as follows.

log_checkpoints = on
log_connections = on
log_disconnections = on
log_temp_files = 0

Top PG Clustering HA Solutions for PostgreSQL

$
0
0

If your system relies on PostgreSQL databases and you are looking for clustering solutions for HA, we want to let you know in advance that it is a complex task, but not impossible to achieve.

We are going to discuss some solutions, from which you will be able to choose taking into account your requirements on fault tolerance.

PostgreSQL does not natively support any multi-master clustering solution, like MySQL or Oracle do. Nevertheless, there are many commercial and community products that offer this implementation, along with others such as replication or load balancing for PostgreSQL.

For a start, let's review some basic concepts:

What is High Availability?

It is the amount of time that a service is available, and is usually defined by the business.

Redundancy is the basis for high availability; in the event of an incident, we can continue to operate without problems.

Continuous Recovery

If and when an incident occurs, we have to restore a backup and then apply the wal logs; The recovery time would be very high and we would not be talking about high availability.

However, if we have the backups and the logs archived in a contingency server, we can apply the logs as they arrive.

If the logs are sent and applied every 1 minute, the contingency base would be in a continuous recovery, and would have an outdated state to the production of at most 1 minute.

Standby databases

The idea of a standby database is to keep a copy of a production database that always has the same data, and that is ready to be used in case of an incident.

There are several ways to classify a standby database:

By the nature of the replication:

  • Physical standbys: Disk blocks are copied.
  • Logical standbys: Streaming of the data changes.

By the synchronicity of the transactions:

  • Asynchronous: There is possibility of data loss.
  • Synchronous: There is no possibility of data loss; The commits in the master wait for the response of the standby.

By the usage:

  • Warm standbys: They do not support connections.
  • Hot standbys: Support read-only connections.

Clusters

A cluster is a group of hosts working together and seen as one.

This provides a way to achieve horizontal scalability and the ability to process more work by adding servers.

It can resist the failure of a node and continue to work transparently.

There are two models depending on what is shared:

  • Shared-storage: All nodes access the same storage with the same information.
  • Shared-nothing: Each node has its own storage, which may or may not have the same information as the other nodes, depending on the structure of our system.

Let's now review some of the clustering options we have in PostgreSQL.

Distributed Replicated Block Device

DRBD is a Linux kernel module that implements synchronous block replication using the network. It actually does not implement a cluster, and does not handle failover or monitoring. You need complementary software for that, for example Corosync + Pacemaker + DRBD.

Example:

  • Corosync: Handles messages between hosts.
  • Pacemaker: Starts and stops services, making sure they are running only on one host.
  • DRBD: Synchronizes the data at the level of block devices.

ClusterControl

ClusterControl is an agentless management and automation software for database clusters. It helps deploy, monitor, manage and scale your database server/cluster directly from its user interface.

ClusterControl is able to handle most of the administration tasks required to maintain database servers or clusters.

With ClusterControl you can:

  • Deploy standalone, replicated or clustered databases on the technology stack of your choice.
  • Automate failovers, recovery and day to day tasks uniformly across polyglot databases and dynamic infrastructures.
  • You can create full or incremental backups and schedule them.
  • Do unified and comprehensive real time monitoring of your entire database and server infrastructure.
  • Easily add or remove a node with a single action.

On PostgreSQL, if you have an incident, your slave can be promoted to master status automatically.

It is a very complete tool, that comes with a free community version (which also includes free enterprise trial).

Node Stats View
Node Stats View
Cluster Nodes View
Cluster Nodes View
ClusterControl
Single Console for Your Entire Database Infrastructure
Find out what else is new in ClusterControl

Rubyrep

Solution of asynchronous, multimaster, multiplatform replication (implemented in Ruby or JRuby) and multi-DBMS (MySQL or PostgreSQL).

Based on triggers, it does not support DDL, users or grants.

The simplicity of use and administration is its main objective.

Some features:

  • Simple configuration
  • Simple installation
  • Platform independent, table design independent.

Pgpool II

It is a middleware that works between PostgreSQL servers and a PostgreSQL database client.

Some features:

  • Connection pool
  • Replication
  • Load balancing
  • Automatic failover
  • Parallel queries

It can be configured on top of streaming replication.

Bucardo

Asynchronous cascading master-slave replication, row-based, using triggers and queueing in the database and asynchronous master-master replication, row-based, using triggers and customized conflict resolution.

Bucardo requires a dedicated database and runs as a Perl daemon that communicates with this database and all other databases involved in the replication. It can run as multimaster or multislave.

Master-slave replication involves one or more sources going to one or more targets. The source must be PostgreSQL, but the targets can be PostgreSQL, MySQL, Redis, Oracle, MariaDB, SQLite, or MongoDB.

Some features:

  • Load balancing
  • Slaves are not constrained and can be written
  • Partial replication
  • Replication on demand (changes can be pushed automatically or when desired)
  • Slaves can be "pre-warmed" for quick setup

Drawbacks:

  • Cannot handle DDL
  • Cannot handle large objects
  • Cannot incrementally replicate tables without a unique key
  • Will not work on versions older than Postgres 8

Postgres-XC

Postgres-XC is an open source project to provide a write-scalable, synchronous, symmetric and transparent PostgreSQL cluster solution. It is a collection of tightly coupled database components which can be installed in more than one hardware or virtual machines.

Write-scalable means Postgres-XC can be configured with as many database servers as you want and handle many more writes (updating SQL statements) compared to what a single database server can do.

You can have more than one database server that clients connect to which provides a single, consistent cluster-wide view of the database.

Any database update from any database server is immediately visible to any other transactions running on different masters.

Transparent means you do not have to worry about how your data is stored in more than one database server internally.

You can configure Postgres-XC to run on multiple servers. Your data is stored in a distributed way, that is, partitioned or replicated, as chosen by you for each table. When you issue queries, Postgres-XC determines where the target data is stored and issues corresponding queries to servers containing the target data.

Citus

Citus is a drop-in replacement for PostgreSQL with built-in high availability features such as auto-sharding and replication. Citus shards your database and replicates multiple copies of each shard across the cluster of commodity nodes. If any node in the cluster becomes unavailable, Citus transparently redirects any writes or queries to one of the other nodes which houses a copy of the impacted shard.

Some features:

  • Automatic logical sharding
  • Built-in replication
  • Data-center aware replication for disaster recovery
  • Mid-query fault tolerance with advanced load balancing

You can increase the uptime of your real-time applications powered by PostgreSQL and minimize the impact of hardware failures on performance. You can achieve this with built-in high availability tools minimizing costly and error-prone manual intervention.

PostgresXL

It is a shared nothing, multimaster clustering solution which can transparently distribute a table on a set of nodes and execute queries in parallel of those nodes. It has an additional component called Global Transaction Manager (GTM) for providing globally consistent view of the cluster. The project is based on the 9.5 release of PostgreSQL. Some companies, such as 2ndQuadrant, provide commercial support for the product.

PostgresXL is a horizontally scalable open source SQL database cluster, flexible enough to handle varying database workloads:

  • OLTP write-intensive workloads
  • Business Intelligence requiring MPP parallelism
  • Operational data store
  • Key-value store
  • GIS Geospatial
  • Mixed-workload environments
  • Multi-tenant provider hosted environments

Components:

  • Global Transaction Monitor (GTM): The Global Transaction Monitor ensures cluster-wide transaction consistency.
  • Coordinator: The Coordinator manages the user sessions and interacts with GTM and the data nodes.
  • Data Node: The Data Node is where the actual data is stored.

Conclusion

There are many more products to create our high availability environment for PostgreSQL, but you have to be careful with:

  • New products, not sufficiently tested
  • Discontinued projects
  • Limitations
  • Licensing costs
  • Very complex implementations
  • Unsafe solutions

You must also take into account your infrastructure. If you have only one application server, no matter how much you have configured the high availability of the databases, if the application server fails, you are inaccessible. You must analyze the single points of failure in the infrastructure well and try to solve them.

Taking these points into account, you can find a solution that adapts to your needs and requirements, without generating headaches and being able to implement your high availability cluster solution. Go ahead and good luck!

New Webinar on How to Design Open Source Databases for High Availability

$
0
0

Join us March 27th for this webinar on how to design open source databases for high availability with Ashraf Sharif, Senior Support Engineer at Severalnines. From discussing high availability concepts through to failover or switch over mechanisms, Ashraf will cover all the need-to-know information when it comes to building highly available database infrastructures.

It’s been said that not designing for failure leads to failure; but what is the best way to design a database system from the ground up to withstand failure?

Designing open source databases for high availability can be a challenge as failures happen in many different ways, which sometimes go beyond imagination. This is one of the consequences of the complexity of today’s open source database environments.

At Severalnines we’re big fans of high availability databases and have seen our fair share of failure scenarios across the thousands of database deployment attempts that we come across every year.

In this webinar, we’ll look at the different types of failures you might encounter and what mechanisms can be used to address them. We will also look at some of popular high availability solutions used today, and how they can help you achieve different levels of availability.

Sign up for the webinar

Date, Time & Registration

Europe/MEA/APAC

Tuesday, March 27th at 09:00 BST / 10:00 CEST (Germany, France, Sweden)

Register Now

North America/LatAm

Tuesday, March 27th at 09:00 PDT (US) / 12:00 EDT (US)

Register Now

Agenda

  • Why design for High Availability?
  • High availability concepts
    • CAP theorem
    • PACELC theorem
  • Trade offs
    • Deployment and operational cost
    • System complexity
    • Performance issues
    • Lock management
  • Architecting databases for failures
    • Capacity planning
    • Redundancy
    • Load balancing
    • Failover and switchover
    • Quorum and split brain
    • Fencing
    • Multi datacenter and multi-cloud setups
    • Recovery policy
  • High availability solutions
    • Database architecture determines Availability
    • Active-Standby failover solution with shared storage or DRBD
    • Master-slave replication
    • Master-master cluster
  • Failover and switchover mechanisms
    • Reverse proxy
    • Caching
    • Virtual IP address
    • Application connector

Sign up for the webinar

Speaker

Ashraf Sharif is System Support Engineer at Severalnines. He was previously involved in hosting world and LAMP stack, where he worked as principal consultant and head of support team and delivered clustering solutions for large websites in the South East Asia region. His professional interests are on system scalability and high availability.

Tips & Tricks for Navigating the PostgreSQL Community

$
0
0

This blog is about the PostgreSQL community, how it works and how best to navigate it. Note that this is merely an overview ... there is a lot of existing documentation.

Overview of the Community, How Development Works

PostgreSQL is developed and maintained by a globally-dispersed network of highly skilled volunteers passionate about relational database computing referred to as the PostgreSQL Global Development Group. A handful of core team members together handle special responsibilities like coordinating release activities, special internal communications, policy announcements, overseeing commit privileges and the hosting infrastructure, disciplinary and other leadership issues as well as individual responsibility for specialty coding, development, and maintenance contribution areas. About forty additional individuals are considered major contributors who have, as the name implies, undertaken comprehensive development or maintenance activities for significant codebase features or closely related projects. And several dozen more individuals are actively making various other contributions. Aside from the active contributors, a long list of past contributors are recognized for work on the project. It is the skill and high standards of this team that has resulted in the rich and robust feature set of PostgreSQL.

Many of the contributors have full-time jobs that relate directly to PostgreSQL or other Open Source software, and the enthusiastic support of their employers makes their enduring engagement with the PostgreSQL community feasible.

Contributing individuals coordinate using collaboration tools such as Internet Relay Chat (irc://irc.freenode.net/PostgreSQL) and PostgreSQL community mailing lists (https://www.PostgreSQL.org/community/lists). If you are new to IRC or mailing lists, then make an effort specifically to read up on etiquette and protocols (one good article appears at https://fedoramagazine.org/beginners-guide-irc/), and after you join, spend some time just listening to on-going conversations and search the archives for previous similar questions before jumping in with your own issues.

Note that the team is not static: Anyone can become a contributor by, well, contributing … but your contribution will be expected to meet those same high standards!

The team maintains a Wiki page (https://wiki.postgresql.org/) that, amongst a lot of very detailed and helpful information like articles, tutorials, code snippets and more, presents a TODO list of PostgreSQL bugs and feature requests and other areas where effort might be needed. If you want to be part of the team, this is a good place to browse. Items are added only after thorough discussion on the developer mailing list.

The community follows a process, visualized as the steps in Figure 1.

Figure 1. Conceptualized outline of the PostgreSQL development process.

That is, the value of any non-trivial new code implementation is expected to be first discussed and deemed (by consensus) desirable. Then investment is made in design: design of the interface, syntax, semantics and behaviors, and consideration of backward compatibility issues. You want to get buy-in from the developer community on what is the problem to be solved and what this implementation will accomplish. You definitely do NOT want to go off and develop something in a vacuum on your own. There’s literally decades worth of very high quality collective experience embodied in the team, and you want, and they expect, to have ideas vetted early.

The PostgreSQL source code is stored and managed using the Git version control system, so a local copy can be checked out from https://git.postgresql.org/ to commence implementation. Note that for durable maintainability, patches must blend in with surrounding code and follow the established coding conventions (http://developer.postgresql.org/pgdocs/postgres/source.html), so it is a good idea to study any similar code sections to learn and emulate the conventions. Generally, the standard format BSD style is used. Also, be sure to update documentation as appropriate.

Testing involves first making sure existing regression tests succeed and that there are no compiler warnings, but also adding corresponding new tests to exercise the newly-implemented feature(s).

When the new functionality implementation in your local repository is complete, use the Git diff functionality to create a patch. Patches are submitted via email to the pgsql-hackers mailing list for review and comments, but you don’t have to wait until your work is complete … smart practise would be to ask for feedback incrementally. The Wiki page describes expectations as to format and helpful explanatory context and how to show respect for code reviewer’s time.

The core developers periodically schedule commit fests, during which all accumulated unapplied patches are added to the source code repository by authorized committers. As a contributor, your code will have undergone rigorous review and likely your own developer skills will be the better for it. To return the favor, there is an expectation that you will devote time to reviewing patches from others.

ClusterControl
Single Console for Your Entire Database Infrastructure
Find out what else is new in ClusterControl

Top Websites to Get Information or Learn PostgreSQL

Community Website - this is the main launching place into life with PostgreSQLhttps://www.postgresql.org/
Wiki - Wide-ranging topics related to PostgreSQLhttps://wiki.postgresql.org/
IRC Channel - Developers are active participants hereirc://irc.freenode.net/PostgreSQL
Source code repositoryhttps://git.postgresql.org/
pgAdmin GUI clienthttps://www.pgadmin.org/
Biographies of significant community membershttps://www.postgresql.org/community/contributors/
Eric Raymond’s famous post on smart questionshttp://www.catb.org/esr/faqs/smart-questions.html
Database schema change controlhttp://sqitch.org/
Database unit testinghttp://pgtap.org/

The Few Tools You Can’t Live Without

The fundamental command line tools for working with a PostgreSQL database are part of the normal distribution. The workhorse is the psql command line utility, which provides an interactive interface with lots of functionality for querying, displaying, and modifying database metadata, as well as executing data definition (DDL) and data manipulation (DML) statements.

Other included utilities of note include pg_basebackup for establishing a baseline for replication-based backup, pg_dump for extracting a database into a script file or other archive file, pg_restore for restoring a from a pg_dump archive, and others. All of these tools have excellent manual pages as well as being detailed in the standard documentation and numerous on-line tutorials.

pgAdmin is a very popular graphical user interface tool that provides similar functionality as the psql command line utility, but with point-and-click convenience. Figure 2 shows a screenshot of pgAdmin III. On the left is a panel showing all the database objects in the cluster on the attached-to host server. You can drill down into the structure to list all databases, schemas, tables, views, functions, etc, and even open tables and views to examine the contained data. For each object, the tool will create the SQL DML for dropping and re-creating the object, too, as shown on the lower right panel. This is a convenient way to make modifications during database development.

Figure 2. The pgAdmin III utility.

A couple of my favorites tools for application developer teams are Sqitch (http://sqitch.org/), for database change control, and pgTAP (http://pgtap.org/). Sqitch enables stand-alone change management and iterative development by means of scripts written in the SQL dialect native to your implementation, not just PostgreSQL. For each database design change, you write three scripts: one to deploy the change, one to undo the change in case reverting to a previous version is necessary, and one to verify or test the change. The scripts and related files can be maintained in your revision control system right alongside your application code. PgTAP is a testing framework that includes a suite of functionality for verifying integrity of the database. All the pgTAP scripts are similarly plain text files compliant with normal revision management and change control processes. Once I started using these two tools, I found it hard to imagine ever again doing database work without.

Tips and Tricks

The PostgreSQL general mailing list is the most active of the various community lists and is the main community interface for free support to users. A pretty broad range of questions appear on this list, sometimes generating lengthy back-and-forth, but most often getting quick, informative, and to-the-point responses.

When posting a question related to using PostgreSQL, you generally want to always include background information including the version of PostgreSQL you are using (listed by the psql command line tool with “psql --version”), the operating system on which the server is running, and then maybe a description of the operating environment, such as whether it may be predominately read heavy or write heavy, typical number of users and concurrency concerns, changes you have made from the default server configuration (i.e., the pg_hba.conf and postgresql.conf files), etc. Oftentimes, a description of what you are trying to accomplish is valuable, rather than some obtuse analogy, as you may well get suggestions for improvement that you had not even thought of on your own. Also, you will get the best response if you include actual DDL, DML, and sample data illustrating the problem and facilitating others to recreate what you are seeing -- yes, people will actually run your sample code and work with you.

Additionally, if you are asking about improving query performance, you will want to provide the query plan, i.e., the EXPLAIN output. This is generated by running your query unaltered except for prefixing it literally with the word “EXPLAIN”, as shown in Figure 3 in the pgAdmin tool or the psql command line utility.

Figure 3. Producing a query plan with EXPLAIN.

Under EXPLAIN, instead of actually running the query, the server returns the query plan, which lists detailed output of how the query will be executed, including which indexes will be used to optimize data access, where table scans might happen, and estimates of the cost and amount of data involved with each step. The kind of help you will get from the experienced practitioners monitoring the mailing list may pinpoint issues and help to suggest possible new indexes or changes to the filtering or join criteria.

Lastly, when participating in mailing list discussions there are two important things you want to keep in mind.

First, the mail list server is set up to send messages configured so that when you reply, by default your email software will reply only to the original message author. To be sure your message goes to the list, you must use your mail software “reply-all” feature, which will then include both the message author and the list address.

Second, the convention on the PostgreSQL mailing lists is to reply in-line and to NOT TOP POST. This last point is a long-standing convention in this community, and for many newcomers seems unusual enough that gentle admonishments are very common. Opinions vary on how much of the original message to retain for context in your reply. Some people chafe at the sometimes unwieldy growth in size of the message when the entire original message is retained in lots of back-and-forth discussion. Me personally, I like to delete anything that is not relevant to what specifically I am replying to so as to keep the message terse and focussed. Just bear in mind that there is decades of mailing list history retained on-line for historical documentation and future research, so retaining context and flow IS considered very important.

This article gets you started, now go forth, and dive in!

Updated: Become a ClusterControl DBA: Managing your Database Configurations

$
0
0

In the past five posts of the blog series, we covered deployment of clustering/replication (MySQL / Galera, MySQL Replication, MongoDB & PostgreSQL), management & monitoring of your existing databases and clusters, performance monitoring and health, how to make your setup highly available through HAProxy and MaxScale and in the last post, how to prepare yourself for disasters by scheduling backups.

Since ClusterControl 1.2.11, we made major enhancements to the database configuration manager. The new version allows changing of parameters on multiple database hosts at the same time and, if possible, changing their values at runtime.

We featured the new MySQL Configuration Management in a Tips & Tricks blog post, but this blog post will go more in depth and cover Configuration Management within ClusterControl for MySQL, PostgreSQL and MongoDB.

ClusterControl Configuration management

The configuration management interface can be found under Manage > Configurations. From here, you can view or change the configurations of your database nodes and other tools that ClusterControl manages. ClusterControl will import the latest configuration from all nodes and overwrite previous copies made. Currently there is no historical data kept.

If you’d rather like to manually edit the config files directly on the nodes, you can re-import the altered configuration by pressing the Import button.

And last but not least: you can create or edit configuration templates. These templates are used whenever you deploy new nodes in your cluster. Of course any changes made to the templates will not retroactively applied to the already deployed nodes that were created using these templates.

MySQL Configuration Management

As previously mentioned, the MySQL configuration management got a complete overhaul in ClusterControl 1.2.11. The interface is now more intuitive. When changing the parameters ClusterControl checks whether the parameter actually exists. This ensures your configuration will not deny startup of MySQL due to parameters that don’t exist.

From Manage -> Configurations, you will find an overview of all config files used within the selected cluster, including load balancer nodes.

We use a tree structure to easily view hosts and their respective configuration files. At the bottom of the tree, you will find the configuration templates available for this cluster.

Changing parameters

Suppose we need to change a simple parameter like the maximum number of allowed connections (max_connections), we can simply change this parameter at runtime.

First select the hosts to apply this change to.

Then select the section you want to change. In most cases, you will want to change the MYSQLD section. If you would like to change the default character set for MySQL, you will have to change that in both MYSQLD and client sections.

If necessary you can also create a new section by simply typing the new section name. This will create a new section in the my.cnf.

Once we change a parameter and set its new value by pressing “Proceed”, ClusterControl will check if the parameter exists for this version of MySQL. This is to prevent any non-existent parameters to block the initialization of MySQL on the next restart.

When we press “proceed” for the max_connections change, we will receive a confirmation that it has been applied to the configuration and set at runtime using SET GLOBAL. A restart is not required as max_connections is a parameter we can change at runtime.

Now suppose we want to change the bufferpool size, this would require a restart of MySQL before it takes effect:

And as expected the value has been changed in the configuration file, but a restart is required. You can do this by logging into the host manually and restarting the MySQL process. Another way to do this from ClusterControl is by using the Nodes dashboard.

Restarting nodes in a Galera cluster

You can perform a restart per node by selecting “Restart Node” and pressing the “Proceed” button.

When you select “Initial Start” on a Galera node, ClusterControl will empty the MySQL data directory and force a full copy this way. This is, obviously, unnecessary for a configuration change. Make sure you leave the “initial” checkbox unchecked in the confirmation dialog. This will stop and start MySQL on the host but depending on your workload and bufferpool size this could take a while as MySQL will start flushing the dirty pages from the InnoDB bufferpool to disk. These are the pages that have been modified in memory but not on disk.

Restarting nodes in a MySQL master-slave topologies

For MySQL master-slave topologies you can’t just restart node by node. Unless downtime of the master is acceptable, you will have to apply the configuration changes to the slaves first and then promote a slave to become the new master.

You can go through the slaves one by one and execute a “Restart Node” on them.

After applying the changes to all slaves, promote a slave to become the new master:

After the slave has become the new master, you can shutdown and restart the old master node to apply the change.

Importing configurations

Now that we have applied the change directly on the database, as well as the configuration file, it will take until the next configuration import to see the change reflected in the configuration stored in ClusterControl. If you are less patient, you can schedule an immediate configuration import by pressing the “Import” button.

PostgreSQL Configuration Management

For PostgreSQL, the Configuration Management works a bit different from the MySQL Configuration Management. In general, you have the same functionality here: change the configuration, import configurations for all nodes and define/alter templates.

The difference here is that you can immediately change the whole configuration file and write this configuration back to the database node.

If the changes made requires a restart, a “Restart” button will appear that allows you to restart the node to apply the changes.

MongoDB Configuration Management

The MongoDB Configuration Management works similar to the MySQL Configuration Management: you can change the configuration, import configurations for all nodes, change parameters and alter templates.

Changing the configuration is pretty straightforward, by using Change Parameter dialog (as described in the "Changing Parameters" section::

Once changed, you can see the post-modification action proposed by ClusterControl in the "Config Change Log" dialog:

You can then proceed to restart the respective MongoDB nodes, one node at a time, to load the changes.

Final thoughts

In this blog post we learned about how to manage, alter and template your configurations in ClusterControl. Changing the templates can save you a lot of time when you have deployed only one node in your topology. As the template will be used for new nodes, this will save you from altering all configurations afterwards. However for MySQL and MongoDB based nodes, changing the configuration on all nodes has become trivial due to the new Configuration Management interface.

As a reminder, we recently covered in the same series deployment of clustering/replication (MySQL / Galera, MySQL Replication, MongoDB & PostgreSQL), management & monitoring of your existing databases and clusters, performance monitoring and health, how to make your setup highly available through HAProxy and MaxScale and in the last post, how to prepare yourself for disasters by scheduling backups.

Key Things to Monitor in PostgreSQL - Analyzing Your Workload

$
0
0

Key Things to Monitor in PostgreSQL - Analyzing Your Workload

In computer systems, monitoring is the process of gathering metrics, analyzing, computing statistics and generating summaries and graphs regarding the performance or the capacity of a system, as well as generating alerts in case of unexpected problems or failures which require immediate attention or action. Therefore, monitoring has two uses: one for historic data analysis and presentation which help us identify medium and long term trends within our system and thus help us plan for upgrades, and a second one for immediate action in case of trouble.

Monitoring helps us identify problems and react to those problems concerning a wide range of fields such as:

  • Infrastructure/Hardware (physical or virtual)
  • Network
  • Storage
  • System Software
  • Application Software
  • Security

Monitoring is a major part of the work of a DBA. PostgreSQL, traditionally, has been known to be “low-maintenance” thanks to its sophisticated design and this means that the system can live with low attendance when compared to other alternatives. However, for serious installations where high availability and performance are of key importance, the database system has to be regularly monitored.

The role of the PostgreSQL DBA can step up to higher levels within the company’s hierarchy besides strictly technical: apart from basic monitoring and performance analysis,  must be able to spot changes in usage patterns, identify the possible causes, verify the assumptions and finally translate the findings in business terms. As an example, the DBA must be able to identify some sudden change in a certain activity that might be linked to a possible security threat. So the role of the PostgreSQL DBA is a key role within the company, and must work closely with other departmental heads in order to identify and solve problems that arise. Monitoring is a great part of this responsibility.

PostgreSQL provides many out of the box tools to help us gather and analyze data. In addition, due to its extensibility, it provides the means to develop new modules into the core system.

PostgreSQL is highly dependent on the system (hardware and software) it runs on. We cannot expect a PostgreSQL server to perform good if there are problems in any of the vital components in the rest of the system. So the role of the PostgreSQL DBA overlaps with the role of the sysadmin. Below, as we examine what to watch in PostgreSQL monitoring, we will encounter both system-dependent variables and metrics as well as PostgreSQL’s specific figures.

Monitoring does not come for free. A good investment must be put in it by the company/organization with a commitment to manage and maintain the whole monitoring process. It also adds a slight load on the PostgreSQL server as well. This is little to worry about if everything is configured correctly, but we must keep in mind that this can be another way to misuse the system.

System Monitoring Basics

Important variables in System monitoring are:

  • CPU Usage
  • Network Usage
  • Disk Space / Disk Utilization
  • RAM Usage
  • Disk IOPS
  • Swap space usage
  • Network Errors

Here is an example of ClusterControl showing graphs for some critical PostgreSQL variables coming from pg_stat_database and pg_stat_bgwriter (which we will cover in the following paragraphs) while running pgbench -c 64 -t 1000 pgbench twice:

We notice that we have a peak on blocks-read in the first run, but we get close to zero during the second run as all blocks are found in shared_buffers.

Other variables of interest are paging activity, interrupts, context switches, among others. There is a plethora of tools to use in Linux/BSDs and unix or unix-like systems. Some of them are:

  • ps: for a list of the processes running

  • top/htop/systat: for system (CPU / memory) utilization monitoring

  • vmstat: for general system activity (including virtual memory) monitoring

  • iostat/iotop/top -mio: for IO monitoring

  • ntop: for network monitoring

Here is an example of vmstat on a FreeBSD box during a query which requires some disk reads and also some computation:

procs  memory      page                         disks      faults          cpu
r b w  avm   fre   flt   re  pi  po   fr    sr  ad0 ad1  in     sy    cs us sy id
0 0 0  98G  666M   421   0   0   0   170  2281    5  0  538   6361  2593  1  1 97
0 0 0  98G  665M   141   0   0   0     0  2288   13  0  622  11055  3748  3  2 94
--- query starts here ---
0 0 0  98G  608M   622   0   0   0   166  2287 1072  0 1883  16496 12202  3  2 94
0 0 0  98G  394M   101   0   0   0     2  2284 4578  0 5815  24236 39205  3  5 92
2 0 0  98G  224M  4861   0   0   0  1711  2287 3588  0 4806  24370 31504  4  6 91
0 0 0  98G  546M    84 188   0   0 39052 41183 2832  0 4017  26007 27131  5  7 88
2 0 0  98G  469M   418   0   0   1   397  2289 1590  0 2356  11789 15030  2  2 96
0 0 0  98G  339M   112   0   0   0   348  2300 2852  0 3858  17250 25249  3  4 93
--- query ends here ---
1 0 0  98G  332M  1622   0   0   0   213  2289    4  0  531   6929  2502  3  2 95

Repeating the query we would not notice any new burst in disk activity since those blocks of disk would already be in the OS’s cache. Although, the PostgreSQL DBA must be able to fully understand what is happening in the underlying infrastructure where the database runs, more complex system monitoring is usually a job for the sysadmin, as this is a large topic in itself.

In linux, a very handy shortcut for the top utility is pressing “C”, which toggles showing the command line of the processes. PostgreSQL by default rewrites the command line of the backends with the actual SQL activity they are running at the moment and also the user.

PostgreSQL Monitoring Basics

Important variables in PostgreSQL monitoring are:

  • Buffer cache performance (cache hits vs disk reads)
  • Number of commits
  • Number of connections
  • Number of sessions
  • Checkpoints and bgwriter statistics
  • Vacuums
  • Locks
  • Replication
  • And last but definitely not least, queries

Generally there are two ways in a monitoring setup to perform data collection:

  • To acquire data via a Log
  • To acquire data by querying PostgreSQL system

Log file-based data acquisition depends on the (properly configured) PostgreSQL log. We can use this kind of logging for “off-line” processing of the data. Log file-based monitoring is best suited when minimal overhead to the PostgreSQL server is required and when we don’t care about live data or about getting live alerts (although live monitoring using log file data can be possible by e.g. directing postgresql log to syslog and then streaming syslog to another server dedicated for log processing).

ClusterControl
Single Console for Your Entire Database Infrastructure
Find out what else is new in ClusterControl

PostgreSQL Statistics Collector

PostgreSQL provides a rich set of views and functions readily available via the Statistics Collector subsystem. Again those data are divided in two categories:

  • Dynamic information on what the system is doing at the moment.
  • Statistics accumulated since the statistics collector subsystem was last reset.

Dynamic statistics views provide info about current activity per process (pg_stat_activity), status of physical replication (pg_stat_replication), status of physical standby (pg_stat_wal_receiver) or logical (pg_stat_subscription), ssl (pg_stat_ssl) and vacuum (pg_stat_progress_vacuum).

Collected statistics views provide info about important background processes such as the wal archiver, the bgwriter, and database objects: user or system tables, indexes, sequences and functions as well as the databases themselves.

It should be quite obvious by now that there are multiple ways to categorize data related to monitoring:

  • By source:
    • System tools (ps, top, iotop, etc)
    • PgSQL Log file
    • Database
      • Dynamic
      • Collected
  • By specific database operation:
    • Buffer cache
    • Commits
    • Queries
    • Sessions
    • Checkpoints
    • Etc

After reading this article and experimenting with the notions, concepts and terms presented, you should be able to make a 2D matrix with all the possible combinations. As an example, the specific PostgreSQL activity (SQL command) can be found using: ps or top (system utilities), the PostgreSQL log files, pg_stat_activity (dynamic view), but also using pg_stat_statements an extension found in contrib (collected stats view). Likewise, information about locks can be found in the PostgreSQL log files, pg_locks and pg_stat_activity (presented just below) using wait_event and wait_event_type. Because of this, it is difficult covering the vast area of monitoring in a uni-dimensional linear fashion, and the author risks creating confusion to the reader because of this. In order to avoid this we will cover monitoring roughly by following the course of the official documentation, and adding related information as needed.

Dynamic Statistics Views

Using pg_stat_activity we are able to see what is the current activity by the various backend processes. For instance if we run the following query on table parts with about 3M rows:

testdb=# \d parts
                         Table "public.parts"
   Column   |          Type          | Collation | Nullable | Default
------------+------------------------+-----------+----------+---------
 id         | integer                |           |          |
 partno     | character varying(20)  |           |          |
 partname   | character varying(80)  |           |          |
 partdescr  | text                   |           |          |
 machine_id | integer                |           |          |
 parttype   | character varying(100) |           |          |
 date_added | date                   |           |          |

And lets run the following query, which needs some seconds to complete:

testdb=# select avg(age(date_added)) FROM parts;

By opening a new terminal and running the following query, while the previous is still running, we get:

testdb=# select pid,usename,application_name,client_addr,backend_start,xact_start,query_start,state,backend_xid,backend_xmin,query,backend_type from pg_stat_activity where datid=411547739 and usename ='achix' and state='active';
-[ RECORD 1 ]----+----------------------------------------
pid              | 21305
usename          | achix
application_name | psql
client_addr      |
backend_start    | 2018-03-02 18:04:35.833677+02
xact_start       | 2018-03-02 18:04:35.832564+02
query_start      | 2018-03-02 18:04:35.832564+02
state            | active
backend_xid      |
backend_xmin     | 438132638
query            | select avg(age(date_added)) FROM parts;
backend_type     | background worker
-[ RECORD 2 ]----+----------------------------------------
pid              | 21187
usename          | achix
application_name | psql
client_addr      |
backend_start    | 2018-03-02 18:02:06.834787+02
xact_start       | 2018-03-02 18:04:35.826065+02
query_start      | 2018-03-02 18:04:35.826065+02
state            | active
backend_xid      |
backend_xmin     | 438132638
query            | select avg(age(date_added)) FROM parts;
backend_type     | client backend
-[ RECORD 3 ]----+----------------------------------------
pid              | 21306
usename          | achix
application_name | psql
client_addr      |
backend_start    | 2018-03-02 18:04:35.837829+02
xact_start       | 2018-03-02 18:04:35.836707+02
query_start      | 2018-03-02 18:04:35.836707+02
state            | active
backend_xid      |
backend_xmin     | 438132638
query            | select avg(age(date_added)) FROM parts;
backend_type     | background worker

The pg_stat_activity view gives us info about the backend process, the user, the client, the transaction, the query, the state as well as a comprehensive info about the waiting status of the query.

But why 3 rows? In versions >=9.6, if a query can be run in parallel, or portions of it can be run in parallel, and the optimizer thinks that parallel execution is the fastest strategy, then it creates a Gather or Gather Merge node, and then requests at most max_parallel_workers_per_gather background worker processes, which by default is 2, hence the 3 rows we see in the output above. We can tell apart the client backend process from the background worker by using the backend_type column. For the pg_stat_activity view to be enabled you’ll have to make sure that the system configuration parameter track_activities is on. The pg_stat_activity provides rich information in order to determine blocked queries by the use of wait_event_type and wait_event columns.

A more refined way to monitor statements is via the pg_stat_statements contrib extension, mentioned earlier. On a recent Linux system (Ubuntu 17.10, PostgreSQL 9.6), this can be installed fairly easy:

testdb=# create extension pg_stat_statements ;
CREATE EXTENSION
testdb=# alter system set shared_preload_libraries TO 'pg_stat_statements';
ALTER SYSTEM
testdb=# \q
postgres@achix-dell:~$ sudo systemctl restart postgresql
postgres@achix-dell:~$ psql testdb
psql (9.6.7)
Type "help" for help.

testdb=# \d pg_stat_statements

Let’s create a table with 100000 rows, and then reset pg_stat_statements, restart the PostgreSQL server, perform a select on this table on the (still cold) system, and then see the contents of pg_stat_statements for the select:

testdb=# select 'descr '||gs as descr,gs as id into medtable from  generate_series(1,100000) as gs;
SELECT 100000
testdb=# select pg_stat_statements_reset();
 pg_stat_statements_reset
--------------------------
 
(1 row)

testdb=# \q
postgres@achix-dell:~$ sudo systemctl restart postgresql
postgres@achix-dell:~$ psql testdb -c 'select * from medtable'> /dev/null
testdb=# select shared_blks_hit,shared_blks_read from pg_stat_statements where query like '%select%from%medtable%';
 shared_blks_hit | shared_blks_read
-----------------+------------------
               0 |              541
(1 row)

testdb=#

Now let’s perform the select * once more and then look again in the contents of pg_stat_statements for this query:

postgres@achix-dell:~$ psql testdb -c 'select * from medtable'> /dev/null
postgres@achix-dell:~$ psql testdb
psql (9.6.7)
Type "help" for help.

testdb=# select shared_blks_hit,shared_blks_read from pg_stat_statements where query like '%select%from%medtable%';
 shared_blks_hit | shared_blks_read
-----------------+------------------
             541 |              541
(1 row)

So, the second time the select statement finds all the required blocks in the PostgreSQL shared buffers, and pg_stat_statements reports this via shared_blks_hit. pg_stat_statements provides info about the total number of calls of a statement, the total_time, min_time, max_time and mean_time, which can be extremely helpful when trying to analyze the workload of your system. A slow query that is run very frequently should require immediate attention. Similarly, consistently low hit rates may signify the need to review the shared_buffers setting.

pg_stat_replication provides info on the current status of replication for each wal_sender. Let’s suppose we have setup a simple replication topology with our primary and one hot standby, then we may query pg_stat_replication on the primary (doing the same on the standby will yield no results unless we have setup cascading replication and this specific standby serves as an upstream to other downstream standbys) to see the current status of replication:

testdb=# select * from pg_stat_replication ;
-[ RECORD 1 ]----+------------------------------
pid              | 1317
usesysid         | 10
usename          | postgres
application_name | walreceiver
client_addr      | 10.0.2.2
client_hostname  |
client_port      | 48192
backend_start    | 2018-03-03 11:59:21.315524+00
backend_xmin     |
state            | streaming
sent_lsn         | 0/3029DB8
write_lsn        | 0/3029DB8
flush_lsn        | 0/3029DB8
replay_lsn       | 0/3029DB8
write_lag        |
flush_lag        |
replay_lag       |
sync_priority    | 0
sync_state       | async

The 4 columns sent_lsn, write_lsn, flush_lsn, replay_lsn tell us the exact WAL position at each stage of the replication process at the remote standby. Then we create some heavy traffic on the primary with a command like:

testdb=# insert into foo(descr) select 'descr ' || gs from generate_series(1,10000000) gs;

And look at pg_stat_replication again:

postgres=# select * from pg_stat_replication ;
-[ RECORD 1 ]----+------------------------------
pid              | 1317
usesysid         | 10
usename          | postgres
application_name | walreceiver
client_addr      | 10.0.2.2
client_hostname  |
client_port      | 48192
backend_start    | 2018-03-03 11:59:21.315524+00
backend_xmin     |
state            | streaming
sent_lsn         | 0/D5E0000
write_lsn        | 0/D560000
flush_lsn        | 0/D4E0000
replay_lsn       | 0/C5FF0A0
write_lag        | 00:00:04.166639
flush_lag        | 00:00:04.180333
replay_lag       | 00:00:04.614416
sync_priority    | 0
sync_state       | async

Now we see that we have a delay between the primary and the standby depicted in the sent_lsn, write_lsn, flush_lsn, replay_lsn values. Since PgSQL 10.0 the pg_stat_replication also shows the lag between a recently locally flushed WAL and the time it took to be remotely written, flushed and replayed respectively. Seeing nulls in those 3 columns means that the primary and the standby are in sync.

The equivalent of pg_stat_replication on the standby side is called: pg_stat_wal_receiver:

testdb=# select * from pg_stat_wal_receiver ;
-[ RECORD 1 ]---------+----------------------------------------------------------------------------------------------------------------------------------------------------------------------------------------------------
pid                   | 17867
status                | streaming
receive_start_lsn     | 0/F000000
receive_start_tli     | 1
received_lsn          | 0/3163F210
received_tli          | 1
last_msg_send_time    | 2018-03-03 13:32:42.516551+00
last_msg_receipt_time | 2018-03-03 13:33:28.644394+00
latest_end_lsn        | 0/3163F210
latest_end_time       | 2018-03-03 13:32:42.516551+00
slot_name             | fbsdclone
conninfo              | user=postgres passfile=/usr/local/var/lib/pgsql/.pgpass dbname=replication host=10.0.2.2 port=20432 fallback_application_name=walreceiver sslmode=disable sslcompression=1 target_session_attrs=any

testdb=#

When there is no activity, and the standby has replayed everything then latest_end_lsn must be equal to sent_lsn on the primary (and all intermediate log sequence numbers).

Similarly to physical replication, in the case of logical replication, where the role of the primary is taken by the publisher, and the role of the standby is taken by the subscriber, naturally the role of pg_stat_wal_receiver is taken by pg_stat_subscription. We can query pg_stat_subscription as follows:

testdb=# select * from pg_stat_subscription ;
-[ RECORD 1 ]---------+------------------------------
subid                 | 24615
subname               | alltables_sub
pid                   | 1132
relid                 |
received_lsn          | 0/33005498
last_msg_send_time    | 2018-03-03 17:05:36.004545+00
last_msg_receipt_time | 2018-03-03 17:05:35.990659+00
latest_end_lsn        | 0/33005498
latest_end_time       | 2018-03-03 17:05:36.004545+00

Note that on the publisher side, the corresponding view is the same as in the case of physical replication: pg_stat_replication.

Collected Statistics Views

pg_stat_archiver view has one row which gives info about the wal archiver. Keeping a snapshot of this row at regular intervals lets you calculate the size of the WAL traffic between those intervals. Also it gives info about failures while archiving WAL files.

pg_stat_bgwriter view gives very important information on the behavior of:

  • The checkpointer
  • The background writer
  • The (client serving) backends

Since this view gives accumulative data since the last reset It is very useful to create another timestamped table with periodic snapshots of pg_stat_bgwriter, so that it will be easy to get an incremental perspective between two snapshots. Tuning is a science (or magic), and it requires extensive logging and monitoring as well as a clear understanding of the underlying concepts and PostgreSQL internals in order to have good results, and this view is where to start, looking for things such as:

  • Are the checkpoints_timed the vast majority of the total checkpoints? If not then actions must be taken, results measured, and iterate the whole process until no improvements are found.
  • Are the buffers_checkpoint a good majority over the other two kinds (buffers_clean but most importantly buffers_backend) ? If buffers_backend are high, then again, certain configurations parameters must be changed, new measurements to be taken and reassessed.

Pg_stat_[user|sys|all]_tables

The most basic usage of those views is to verify that our vacuum strategy works as expected. Large values of dead tuples relative to live tuples signifies inefficient vacuuming. Those views also provide info on seq vs index scans and fetches, info about num of rows inserted, updated, deleted as well as HOT updates. You should try to keep the number of HOT updates as high as possible in order to improve performance.

Pg_stat_[user|sys|all]_indexes

Here the system stores and shows info on individual index usage. One thing to keep in mind is that idx_tup_read is more accurate than idx_tup_fetch. Non PK/ non unique Indexes with low idx_scan should be considered for removal, since they only hinder HOT updates. As mentioned in the previous blog, over-indexing should be avoided, indexing comes at a cost.

Pg_statio_[user|sys|all]_tables

In those views we can find info on the performance of the cache regarding table heap reads, index reads and TOAST reads. A simple query to count for the percentage of hits, and the distribution of the hits across tables would be:

with statioqry as (select relid,heap_blks_hit,heap_blks_read,row_number() OVER (ORDER BY 100.0*heap_blks_hit::numeric/(heap_blks_hit+heap_blks_read) DESC),COUNT(*) OVER () from pg_statio_user_tables where heap_blks_hit+heap_blks_read >0)
select relid,row_number,100.0*heap_blks_hit::float8/(heap_blks_hit+heap_blks_read) as "heap block hits %", 100.0 * row_number::real/count as "In top %" from statioqry order by row_number;
   relid   | row_number | heap block hits % |     In top %      
-----------+------------+-------------------+-------------------
     16599 |          1 |  99.9993058404502 | 0.373134328358209
     18353 |          2 |  99.9992251425738 | 0.746268656716418
     18338 |          3 |    99.99917566565 |  1.11940298507463
     17269 |          4 |  99.9990617323798 |  1.49253731343284
     18062 |          5 |  99.9988021889522 |  1.86567164179104
     18075 |          6 |  99.9985334109273 |  2.23880597014925
     18365 |          7 |  99.9968070500335 |  2.61194029850746
………..
     18904 |        127 |  97.2972972972973 |  47.3880597014925
     18801 |        128 |  97.1631205673759 |  47.7611940298507
     16851 |        129 |  97.1428571428571 |   48.134328358209
     17321 |        130 |  97.0043198249512 |  48.5074626865672
     17136 |        131 |                97 |  48.8805970149254
     17719 |        132 |  96.9791612263018 |  49.2537313432836
     17688 |        133 |   96.969696969697 |  49.6268656716418
     18872 |        134 |  96.9333333333333 |                50
     17312 |        135 |  96.8181818181818 |  50.3731343283582
……………..
     17829 |        220 |  60.2721026527734 |   82.089552238806
     17332 |        221 |  60.0276625172891 |  82.4626865671642
     18493 |        222 |                60 |  82.8358208955224
     17757 |        223 |  59.7222222222222 |  83.2089552238806
     17586 |        224 |  59.4827586206897 |  83.5820895522388

This tells us that at least 50% of the tables have hit rates larger than 96.93%, and 83.5% of the tables have a hit rate better than 59.4%

Pg_statio_[user|sys|all]_indexes

This view contains block read/hit information for indexes.

Pg_stat_database

This view contains one row per database. It shows some of the info of the preceding views aggregated to the whole database (blocks read, blocks hit, info on tups), some information relevant to the whole database (total xactions, temp files, conflicts, deadclocks, read/write time), and finally number of current backends.

Things to look for here are the ratio of blks_hit/(blks_hit + blks_read): the higher the value the better for the system’s I/O. However misses should not necessarily be accounted for disk reads as they may have very well been served by the OS’s filesys cache.

Similarly to other collected statistics views mentioned above, one should create a timestamped version of the pg_stat_database view and have a view at the differences between two consecutive snapshots:

  • Are the number of rollbacks increasing?
  • Or the number of committed xactions?
  • Are we getting way more conflicts than yesterday (this applies to standbys)?
  • Do we have abnormally high numbers of deadlocks?

All those are very important data. The first two might mean some change in some usage pattern, that must be explained. High number of conflicts might mean replication needs some tuning. High number of deadlocks is bad for many reasons. Not only performance is low because transactions get rolled back, but also if an application suffers from deadlocks in a single master topology, the problems will only get amplified if we move to multi-master. In this case, the software engineering department must rewrite the pieces of the code that cause the deadlocks.

Locks

Locking is a very important topic in PostgreSQL and deserves its own blog(s). Nevertheless basic locks monitoring has to be done in the same fashion as the other aspects of monitoring presented above. pg_locks view provides real time information on the current locks in the system. We may catch long waiting locks by setting log_lock_waits, then information on long waiting waits will be logged in the PgSQL log. If we notice unusual high locking which results in long waits then again, as in the case with the deadlocks mentioned above, the software engineers must review any pieces of code that might cause long held locks, e.g. explicit locking in the application (LOCK TABLE or SELECT … FOR UPDATE).

Similarly to the case of deadlocks, a system with short locks will move easier to a multi-master setup.


Migrating from MySQL to PostgreSQL - What You Should Know

$
0
0

Whether migrating a database or project from MySQL to PostgreSQL, or choosing PostgreSQL for a new project with only MySQL knowledge, there are a few things to know about PostgreSQL and the differences between the two database systems.

PostgreSQL is a fully open source database system released under its own license, the PostgreSQL License, which is described as "a liberal Open Source license, similar to the BSD or MIT licenses.” This has allowed The PostgreSQL Global Development Group (commonly referred to as PGDG), who develops and maintains the open source project, to improve the project with help from people around the world, turning it into one of the most stable and feature rich database solutions available. Today, PostgreSQL competes with the top proprietary and open source database systems for features, performance, and popularity.

PostgreSQL is a highly compliant Relational Database System that’s scalable, customizable, and has a thriving community of people improving it every day.

What PostgreSQL Needs

In a previous blog, we discussed setting up and optimizing PostgreSQL for a new project. It is a good introduction to PostgreSQL configuration and behavior, and can be found here: https://severalnines.com/blog/setting-optimal-environment-postgresql.

If migrating an application from MySQL to PostgreSQL, the best place to start would be to host it on similar hardware or hosting platform as the source MySQL database.

On Premise

If hosting the database on premise, bare metal hosts (rather than Virtual Machines) are generally the best option for hosting PostgreSQL. Virtual Machines do add some helpful features at times, but they come at the cost of losing power and performance from the host in general, while bare metal allows the PostgreSQL software to have full access to performance with fewer layers between it and the hardware. On premise hosts would need an administrator to maintain the databases, whether it’s a full time employee or contractor, whichever makes more sense for the application needs.

In The Cloud

Cloud hosting has come a long way in the past few years, and countless companies across the world host their databases in cloud based servers. Since cloud hosts are highly configurable, the right size and power of host can be selected for the specific needs of the database, with a cost that matches.

Depending on the hosting option used, new hosts can be provisioned quickly, memory / cpu / disk can be tweaked quickly, and even additional backup methods can be available. When choosing a cloud host, look for whether a host is dedicated or shared, dedicated being better for extremely high load databases. Another key is to make sure the IOPS available for the cloud host is good enough for the database activity needs. Even with a large memory pool for PostgreSQL, there will always be disk operations to write data to disk, or fetch data when not in memory.

Cloud Services

Since PostgreSQL is increasing in popularity, it’s being found available on many cloud database hosting services like Heroku, Amazon AWS, and others, and is quickly catching up to the popularity of MySQL. These services allow a third party to host and manage a PostgreSQL database easily, allowing focus to remain on the application.

Concepts / term comparisons

There are a few comparisons to cover when migrating from MySQL to PostgreSQL, common configuration parameters, terms, or concepts that operate similarly but have their differences.

Database Terms

Various database terms can have different meanings within different implementations of the technology. Between MySQL and PostgreSQL, there’s a few basic terms that are understood slightly differently, so a translation is sometimes needed.

“Cluster”

In MySQL, a ‘cluster’ usually refers to multiple MySQL database hosts connected together to appear as a single database or set of databases to clients.

In PostgreSQL, when referencing a ‘cluster’, it is a single running instance of the database software and all its sub-processes, which then contains one or more databases.

“Database”

In MySQL, queries can access tables from different databases at the same time (provided the user has permission to access each database).

SELECT *
FROM customer_database.customer_table t1
JOIN orders_database.order_table t2 ON t1.customer_id = t2.customer_id
WHERE name = ‘Bob’;

However in PostgreSQL this cannot happen unless using Foreign Data Wrappers (a topic for another time). Instead, a PostgreSQL database has the option for multiple ‘schemas’ which operate similarly to databases in MySQL. Schemas contain the tables, indexes, etc, and can be accessed simultaneously by the same connection to the database that houses them.

SELECT *
FROM customer_schema.customer_table t1
JOIN orders_schema.order_table t2 ON t1.customer_id = t2.customer_id
WHERE name = ‘Bob’;

Interfacing with the PostgreSQL

In the MySQL command line client (mysql), interfacing with the database uses key works like ‘DESCRIBE table’ or ‘SHOW TABLES’. The PostgreSQL command line client (psql) uses its own form of ‘backslash commands’. For example, instead of ‘SHOW TABLES’, PostgreSQL’s command is ‘\dt’, and instead of ‘SHOW DATABASES;’, the command is ‘\l’.

A full list of commands for ‘psql’ can be found by the backslash command ‘\?’ within psql.

Language Support

Like MySQL, PostgreSQL has libraries and plugins for all major languages, as well as ODBC drivers along the lines of MySQL and Oracle. Finding a great and stable library for any language needed is an easy task.

Stored Procedures

Unlike MySQL, PostgreSQL has a wide range of supported Procedural Languages to choose from. In the base install of PostgreSQL, the supported languages are PL/pgSQL (SQL Procedural Language), PL/Tcl (Tcl Procedural Language), PL/Perl (Perl Procedural Language), and PL/Python (Python Procedural Language). Third party developers may have more languages not officially supported by the main PostgreSQL group.

Configuration

  • Memory

    MySQL tunes this with key_buffer_size when using MyISAM, and with innodb_buffer_pool_size when using InnoDB.

    PostgreSQL uses shared_buffers for the main memory block given to the database for caching data, and generally sticks around 1/4th of system memory unless certain scenarios require that to change. Queries using memory for sorting use the work_mem value, which should be increased cautiously.

Tools for migration

Migrating to PostgreSQL can take some work, but there are tools the community has developed to help with the process. Generally they will convert / migrate the data from MySQL to PostgreSQL, and recreate tables / indexes. Stored Procedures or functions, are a different story, and usually require manual re-writing either in part, or from the ground up.

Some example tools available are pgloader and FromMySqlToPostgreSql. Pgloader is a tool written in Common Lisp that imports data from MySQL into PostgreSQL using the COPY command, and loads data, indexes, foreign keys, and comments with data conversion to represent the data correctly in PostgreSQL as intended. FromMySqlToPostgreSql is a similar tool written in PHP, and can convert MySQL data types to PostgreSQL as well as foreign keys and indexes. Both tools are free, however many other tools (free and paid) exist and are newly developed as new versions of each database software are released.

Converting should always include in depth evaluation after the migration to make sure data was converted correctly and functionality works as expected. Testing beforehand is always encouraged for timings and data validation.

Replication Options

If coming from MySQL where replication has been used, or replication is needed at all for any reason, PostgreSQL has several options available, each with its own pros and cons, depending on what is needed through replication.

  • Built In:

    By default, PostgreSQL has its own built in replication mode for Point In Time Recovery (PITR). This can be set up using either file-based log shipping, where Write Ahead Log files are shipped to a standby server where they are read and replayed, or Streaming Replication, where a read only standby server fetches transaction logs over a database connection to replay them.

    Either one of these built in options can be set up as either a ‘warm standby’ or ‘hot standby.’ A ‘warm standby’ doesn’t allow connections but is ready to become a master at any time to replace a master having issues. A ‘hot standby’ allows read-only connections to connect and issue queries, in addition to being ready to become a read/write master at any time as well if needed.

  • Slony:

    One of the oldest replication tools for PostgreSQL is Slony, which is a trigger based replication method that allows a high level of customization. Slony allows the setup of a Master node and any number of Replica nodes, and the ability to switch the Master to any node desired, and allows the administrator to choose which tables (if not wanting all tables) to replicate. It’s been used not just for replicating data in case of failure / load balancing, but shipping specific data to other services, or even minimal downtime upgrades, since replication can go across different versions of PostgreSQL.

    Slony does have the main requirement that every table to be replicated have either a PRIMARY KEY, or a UNIQUE index without nullable columns.

  • Bucardo:

    When it comes to multi-master options, Bucardo is one of few for PostgreSQL. Like Slony, it’s a third party software package that sits on top of PostgreSQL. Bucardo calls itself “an asynchronous PostgreSQL replication system, allowing for both multi-master and multi-slave operations.” The main benefit is multi-master replication, that works fairly well, however it does lack conflict resolution, so applications should be aware of possible issues and fix accordingly.

    There are many other replication tools as well, and finding the one that works best for an application depends on the specific needs.

ClusterControl
Single Console for Your Entire Database Infrastructure
Find out what else is new in ClusterControl

Community

PostgreSQL has a thriving community willing to help with any issues / info that may be needed.

  • IRC

    An active IRC chatroom named #postgresql is available on freenode, as administrators and developers world wide chat about PostgreSQL and related projects / issues. There’s even smaller rooms for specifics like Slony, Bucardo, and more.

  • Mailing lists

    There are a handful of PostgreSQL mailing lists for ‘general’, ‘admin’, ‘performance’, and even ‘novice’ (a great place to start if new to PostgreSQL in general). The mailing lists are subscribed to by many around the world, and provide a very useful wealth of resources to answer any question that may need answering.

    A full list of PostgreSQL mailing lists can be found at https://www.postgresql.org/list/

  • User Groups

    User groups are a great place to get involved and active in the community, and many large cities worldwide have a PostgreSQL User Group (PUG) available to join and attend, and if not, consider starting one. These groups are great for networking, learning new technologies, and even just asking questions in person to people from any level of experience.

  • Documentation

    Most Importantly, PostgreSQL is documented very well. Any information for configuration parameters, SQL functions, usage, all can be easily learned through the official documentation provided on PostgreSQL’s website. If at all anything is unclear, the community will help in the previous outlined options.

The Best Alert and Notification Tools for PostgreSQL

$
0
0

As part of their enterprise monitoring system, organizations rely on alerts and notifications as their first line of defense to achieving high availability and consequently lowering outage costs.

Alerts and notifications are sometimes used interchangeably, for example we can say “I have received a high load system alert”, and replacing “alert” with “notification” will not change the message meaning. However, in the world of management systems it is important to note the difference: alerts are events generated as a result of a system trouble and notifications are used to deliver information about system status, including trouble. As an example the Severalnines blog Introducing the ClusterControl Alerting Integrations discusses one of the ClusterControl’s integration features, the notification system which is able to deliver alerts via email, chat services, and incident management systems. Also see PostgreSQL Wiki — Alerts and Status Notifications.

In order to accurately monitor the PostgreSQL database activity, a management system relies on the database activity metrics, custom features or monitor advisors, and monitoring log files.

In this article I review the tools listed in the PostgreSQL Wiki, the Monitoring and PostgreSQL GUI sections, skipping those that aren’t actively maintained, or do not provide alerting and notifications either within the product or with a free trial account. While not an exhaustive review, each tool was installed and configured up to the point where I could understand its alerting and notification capabilities.

Nagios

Nagios is a popular on-premise, general purpose monitoring system that offers an wide range of plugins. While Nagios Core is open source, the recommended solution for monitoring PostgreSQL is Nagios XI.

Notification settings are per user, and in order to change them the administrator must “login as” the user — Nagios uses the term masquerade as. Once on the account setting page, the user can choose to enable or disable the notification methods:

Nagios XI Notification Preferences

In order to configure the types of notifications, head to the “Notification Methods” page:

Nagios XI Notification Methods

See the Nagios XI User Guide for more details.

To configure alerts, log in as administrator and select the database configuration wizard:

Nagios XI Database Configuration Wizard

Once configured, the alerts can be viewed by selecting any of the default views, dashboards, or we can configure a custom one. Out of the box, Nagios XI provides the following PostgreSQL monitors:

Nagios XI PostgreSQL monitors

Note that out of the box Nagios XI doesn’t provide any metrics based on the PostgreSQL Statistics Collector, instead each metric must be defined using the “Postgres Query” configuration wizard:

Nagios XI Postgres Query

Datadog

Datadog is a general purpose SaaS monitoring tool featuring a very large set of integrations with a variety of services. To start monitoring, select the PostgreSQL integration, and then choose the notifications integrations such as email, chat (e.g. Slack), or incident response systems such as PagerDuty:

Datadog Integrations

In order to receive notifications via the integration channels configured earlier, we need to create at least one Datadog monitor, in the case of PostgreSQL monitoring an “integration” monitor type:

Datadog PostgreSQL Integration

The first step in configuring the monitor is selecting an alert type:

Datadog Detection Method

Next, configure one or more metrics:

Datador Metrics Configuration

Configure the conditions for triggering the alert:

Datadog Alert Trigger

Notifications can be customized using template variables:

Datadog Postgres Integration

Finally provide a list of recipients to receive notifications:

Datadog Notification Recipients

The events Datadog can monitor on are listed under the PostgreSQL integration “Metrics” section, and are based on the PostgreSQL Statistics Collector predefined views:

Datadog Postgres Integration Metrics

In order to monitor for events not provided with the default integration, Datadog provides customers with the option of creating custom metrics limited to the Datadog plan.

Okmeter

Okmeter is also part of the SaaS general purpose monitoring family, and just as other SaaS tools, requires an agent on the monitored host. Once the agent is installed, a set of default event triggers are enabled, including a PostgreSQL connection check:

Okmeter Autotriggers

Getting more PostgreSQL metrics requires adding a PostgreSQL “server”:

Okmeter - Adding a server

In order to monitor PostgreSQL statistics, similarly to Nagios and Datadog, we must configure custom metrics as explained in the Okmeter Documentation — Sending Custom metrics. Or, edit the “PostgreSQL server” metric above to include for views in the “okmeter.pg_stats” function.

The Okmeter query statistics documentation page explains how to enable tracking of execution statistics for the SQL statements. Note that there are a few limitations in using the “pg_stat_statements” views e.g. maximum number of distinct statements that can be recorded by a module — see the PostgreSQL documentation on pg_stat_statements for details.

The notification contacts page is where notifications are configured for each user:

Okmeter Contact Notification

Notification messages can be further customized using templates:

Okmeter Notification Message Template

Circonus

Circonus, another SaaS general monitoring product, features a PostgreSQL “check” which can be enabled individually or added as part of the one-step install:

Circonus Check setup

According to Circonus PostgreSQL documentation the check is performed from a remote location via direct SQL statements. After configuring the PostgreSQL host to accept connections from a Circonus broker, the wizard will present a list of available metrics:

Circonus PostgreSQL check

In order to configure alerts, each metric is associated with a set of rules and a list of contacts to be notified.

Circonus Metric Details

Alerts are categorized based on severity levels:

Circonus Rulesets Severity Levels

Notification channels include SMS, OpsGenie, Slack, VictorOps, and PagerDuty (no email). The screenshot below shows a Slack integration:

Circonus Contact Groups

In order to configure notifications, each metric in the check must be assigned rules and contacts. Note that contacts must be created prior to editing the metric:

Circonus Rulesets
Circonus Rulesets

New Relic

New Relic is another SaaS general monitoring system. When it comes to PostgreSQL there are (as of this writing) three available plugins. The most recent one is the Blue Medora plugin:

New Relic PostgreSQL plugin from Blue Medora

Once the plugin is working it becomes visible on the plugins page and we are ready to configure alerts:

New Relic Alerts Setup

New Relic uses the concept of alert policies to group alerts into incidents. Before configuring a policy we must setup the notifications channels. Out of the box, New Relic integrates with all popular incident response systems, as well as email:

New Relic Channel Types

Note that the integration must be first enabled in the notification application. For example selecting Slack from the list of channel types:

New Relic Slack Integration

Next create an “alert policy”:

New Relic Alert Policy

An alert policy requires an “alert condition”. The next set of screenshots show the steps to achieve just that:

New Relic PostgreSQL Condition Category
New Relic PostgreSQL Condition Entity
New Relic PostgreSQL Condition Threshold

Finally select the notification channels tab in order to modify the default:

New Relic PostgreSQL Notification Channels

Optionally, add the alert condition to New Relic Insights (requires additional subscription):

New Relic Insights
New Relic Insights

Postgres Enterprise Manager

PEM or Postgres Enterprise Manager is a tool for managing, tuning, and monitoring PostgreSQL.

It comes with a very rich set of predefined metrics:

Postgres Enterprise Manager Predefined Metrics

In order to modify the default alerts, or create custom ones, use the alert templates:

Postgres Enterprise Manager Custom Alert Template

PEM relies on email and SNMP for notifications, so it can easily integrate with monitoring systems such as Nagios, but there aren’t any integrations with the popular incident management systems (PagerDuty, VictorOps, OpsGenie), or chat services (Slack) found in the other products.

Postgres Enterprise Manager Email & SNMP alerting

pgwatch2

pgwatch2 is another PostgreSQL centric monitoring tool, self-hosted solution.

In order to define alerts, we must first create a custom dashboard and define the metric:

pgwatch2 Dashboard Metrics

Next, configure the alert:

pgwatch2 Dashboard Alert Config

Once configured, the alerts will show up on the Alerts List page:

pgwatch2 Dashboard Alert List

pgwatch2 integrates with all popular notification systems. Here’s an example of adding a Slack channel:

pgwatch2 Slack Integration

To view the notification channels configured in the system, open up the “Notification channels” page:

pgwatch2 Notification Channels

Additional metrics can be added as documented in the pgwatch2 Features section.

ClusterControl

ClusterControl is an on premise database oriented management system with support for PostgreSQL, MySQL, MariaDB, and MongoDB.

First step is adding a notification integration. More information about available integrations is available at Introducing the ClusterControl Alerting Integrations:

ClusterControl Integrations

For the purpose of this demo, I’ve configured Slack:

ClusterControl Slack Integration

ClusterControl also offers the option of notifying via email:

ClusterControl Notifications via Email

Once notifications are in place, create custom advisors in order to trigger alerts based on specific criteria:

ClusterControl Custom Advisors
ClusterControl
Single Console for Your Entire Database Infrastructure
Find out what else is new in ClusterControl

Conclusion

The article wasn’t intended to be a deep dive into the functionality of each tool, rather I attempted to outline what I considered to be the important features related to alerting and notifications for PostgreSQL, specifically.

One of the lessons learned is that the selection process should take several factors in consideration:

  • on premise or SaaS
  • agent-based or remote check
  • integration with incident management systems and chat services
  • availability of monitored metrics, out of the box, and plugins
  • ability to add custom metrics
  • alert management features (e.g. grouping)
  • complexity vs granularity in the user interface
  • additional functionality (management, tuning, API, etc.)

Also, if one solution doesn’t meet all the business and/or technical requirements, it is always possible to use a combination of services.

Migrating from Oracle to PostgreSQL - What You Should Know

$
0
0

Whether migrating a database or an application from Oracle to PostgreSQL with only one type of database knowledge, there are few things to know about the differences between the two database systems.

PostgreSQL is the world’s most advanced open source database. PostgreSQL community is very strong and they are continuously improving existing PostgreSQL features and also add new features. As per the db-engines.com, PostgreSQL is the DBMS of the year 2017.

There are some incompatibilities in Oracle and PostgreSQL. The behaviour of some functions is different between Oracle and PostgreSQL.

Why Migrate from Oracle to PostgreSQL

  1. Cost: As you may know Oracle licence cost is very expensive and there is additional cost for some features like partitioning and high availability. So overall it's very expensive.
  2. Flexible open source licensing and easy availability from public cloud providers like AWS.
  3. Benefit from open source add-ons to improve performance.

Preliminary Check

As you may know migration from Oracle to PostgreSQL is a costly and time consuming task. It is important to understand which part is to migrate. Do not waste time for migrating objects that are no longer required. Also, check whether there is any historical data required or not. Do not waste time replicating data that you don’t need, for example backup data and temporary table from past maintenance.

Migration Assessment

After preliminary check, the first step of migration is to analyze the application and database object, find out the incompatibilities between both the databases and estimate the time and cost required for migration.

Ora2pg tool is very helpful for migration assessment. It connects to the Oracle database, scan it automatically and extracts the data, generating the database migration report. You can check a sample report in Ora2pg.

What You Should Know

Understand the differences between Oracle and PostgreSQL and convert it using any tool. There is no any tool that can convert 100% Oracle database into PostgreSQL, some manual changes are required. Please check below some of the important differences you should know before migrating.

Data Type Mapping

PostgreSQL has rich set of data types. Some of the important Data type conversion between Oracle and PostgreSQL is as follow.

OraclePostgreSQLComment
VARCHAR2(n)VARCHAR(n)In Oracle ‘n’ is number of bytes whereas in PostgreSQL ‘n’ is number of characters
CHAR(n)CHAR(n)In Oracle ‘n’ is number of bytes whereas in PostgreSQL ‘n’ is number of characters
NUMBER(n,m)NUMERIC(n,m)NUMBER type can be converted to NUMERIC but if you use SMALLINT, INT and BIGINT then performance would be better.
NUMBER(4)SMALLINT
NUMBER(9)INT
NUMBER(18)BIGINT
NUMBER(n)NUMERIC(n)NUMERIC(n) ,If n>=19
DATETIMESTAMP(0)Both databases has DATE type but Oracle DATE type returns date and time whereas PostgreSQL DATE type return only date no time.
TIMESTAMP WITH LOCAL TIME ZONETIMESTAMPTZThe PostgreSQL type Timestamptz(Timestamp with time zone) is different from the Oracle Timestamp with time zone. It is equivalent to Oracle’s Timestamp with local time zone, but this small difference can cause performance issue or application bug.
CLOBTEXTPostgreSQL TEXT type can store up to 1 GB of text.
BLOB
RAW(n)
BYTEA(1 GB limit)
Large object
In Oracle, BLOB datatype stores unstructured binary data in the database. BLOB type can store up to 128 terabytes of binary data. PostgreSQL BYTEA stores binary data but only upto 1 GB. If the data if above 1 GB then use Large object.

Transactions

Oracle database always uses transactions but in PostgreSQL you have to activate that. In Oracle, the transaction starts when executing any statement and ends when COMMIT statement executed. In PostgreSQL, transaction starts when execute BEGIN and end when COMMIT statement executed. Even the isolation levels also have no problem. PostgreSQL database knows all the isolation levels that Oracle database knows. The default isolation level of PostgreSQL is Read committed.

Example:

Oracle:

DELETE FROM table_name WHERE id = 120;
COMMIT;

PostgreSQL:

BEGIN;
DELETE FROM table_name WHERE id  = 120;
COMMIT;

Dual Table

In Oracle FROM clause is mandatory for every SELECT statement so Oracle database uses DUAL table for SELECT statement where table name is not required. In PostgreSQL, FROM clause is not mandatory so DUAL table is not necessary. The Dual table can be created in PostgreSQL as a view to eliminate the porting problem. Orafce tool have implemented this so you can use Orafce also.

Example:

postgres=# SELECT CURRENT_TIMESTAMP FROM DUAL;
ERROR:  relation "dual" does not exist
LINE 1: SELECT CURRENT_TIMESTAMP FROM DUAL;
                                      ^
postgres=# SELECT CURRENT_TIMESTAMP;
       current_timestamp
-------------------------------
 2018-03-16 09:36:01.205925+00
(1 row)

After installing Orafce module:

postgres=# SELECT CURRENT_TIMESTAMP FROM DUAL;
       current_timestamp
-------------------------------
 2018-03-16 09:36:01.205925+00
(1 row)

SYSDATE

Oracle's SYSDATE function returns date and time. The behaviour of SYSDATE function is different in different places. PostgreSQL does not have any function corresponding to SYSDATE function.  In PostgreSQL there are multiple methods to get the date and time and it is based on the application purpose.

Time retrieval methodFunction to be used
SQL start timeStatement_timestamp()
Transaction start timenow() or


Transaction_timestamp()

Time when the function is implementedClock_timestamp()

In the below example clock_timestamp() returns the time when actual function is executed and other statement_timestamp() returns the time when the SQL statement started it’s execution.

postgres=# SELECT now(), statement_timestamp(), current_timestamp, transaction_timestamp(), clock_timestamp();
              now              |      statement_timestamp      |       current_timestamp       |     transaction_timestamp     |        clock_timestamp
 
-------------------------------+-------------------------------+-------------------------------+-------------------------------+-------------------------------
 2018-03-16 09:27:56.163154+00 | 2018-03-16 09:27:56.163154+00 | 2018-03-16 09:27:56.163154+00 | 2018-03-16 09:27:56.163154+00 | 2018-03-16 09:27:56.163281+00
 (1 row)

TO_DATE(two argument)

Oracle’s TO_DATE function return DATE type value(year, month, day, hour, minute, second) while PostgreSQL’s TO_DATE(two_argument) return DATE type value(year, month, day).

The solution for this incompatibility is to convert TO_DATE() to TO_TIMESTAMP(). If you use Orafce tool then not necessary to change anything because Orafce implemented this function so we get the same result sa Oracle.

Oracle:

SELECT TO_DATE ('20180314121212','yyyymmddhh24miss') FROM dual;

PostgreSQL:

SELECT TO_TIMESTAMP ('20180314121212','yyyymmddhh24miss')::TIMESTAMP(0);

SYNONYM

CREATE SYNONYM is not supported in PostgreSQL. In Oracle CREATE SYNONYM is used to access remote objects while in PostgreSQL we can use SET search_path to include the remote definition.

Oracle:

CREATE SYNONYM abc.table_name FOR pqr.table_name;

PostgreSQL:

SET search_path TO 'abc.table_name';

Behaviour of Empty String and NULL

In Oracle, empty strings and NULL values in string context are the same. The concatenation of NULL and string obtain string as a result. In PostgreSQL the concatenation result is null in this case. In Oracle IS NULL operator is used to check whether string is empty or not but in PostgreSQL result is FALSE for empty string and TRUE for NULL.

Sequences

There is a slight difference in the syntax of sequence in Oracle and PostgreSQL.

Oracle:

Sequence_name.nextval

PostgreSQL:

Nextval(‘sequence_name’)

To change this syntax you can create a script or you can change it manually.

SUBSTR

The behaviour of SUBSTR function in Oracle and PostgreSQL is different. The SUBSTR function works in PostgreSQL without error but returns a different result. This difference can cause application bugs.

Oracle:

SELECT SUBSTR(‘ABC’,-1) FROM DUAL;
Returns ‘C’

PostgreSQL:

postgres=# SELECT SUBSTR('ABC',-1);
 substr
--------
 ABC
(1 row)

The solution for this is to use Orafce SUBSTR function which returns the same result as Oracle in PostgreSQL.

DELETE Statement

In Oracle, DELETE statement can work without FROM clause but in PostgreSQL it is not supported. We need to add FROM clause in PostgreSQL DELETE statement manually.

Oracle:

DELETE table_name WHERE column_name = 'Col_value';

PostgreSQL:

DELETE FROM table_name WHERE column_name = 'Col_value';

External Coupling +

Oracle uses + operator for left and right join but PostgreSQL does not use it.

Oracle:

SELECT a1.name1, a2.name2
     FROM a1, a2
     WHERE a1.code = a2.code (+);

PostgreSQL:

SELECT a1.name1, a2.name2
    FROM a1
    LEFT OUTER JOIN a2 ON a1.code = a2.code;

START WITH..CONNECT BY

Oracle uses START WITH..CONNECT BY for hierarchical queries. PostgreSQL does not support START WITH..CONNECT BY statement. PostgreSQL have WITH RECURSIVE for hierarchical queries so translate CONNECT BY statement into WITH RECURSIVE statement.

Oracle:

SELECT 
    restaurant_name, 
    city_name 
FROM 
    restaurants rs 
START WITH rs.city_name = 'TOKYO' 
CONNECT BY PRIOR rs.restaurant_name = rs.city_name;

PostgreSQL:

WITH RECURSIVE tmp AS (SELECT restaurant_name, city_name
                                 FROM restaurants
                                WHERE city_name = 'TOKYO'
                                UNION
                               SELECT m.restaurant_name, m.city_name
                                 FROM restaurants m
                                 JOIN tmp ON tmp.restaurant_name = m.city_name)
                  SELECT restaurant_name, city_name FROM tmp;

PLSQL to PLPGSQL Conversion

PostgreSQL’s PL/pgSQL language is similar to Oracle’s PL/SQL language in many aspects. It is a block-structured, imperative language, and all variables have to be declared. In both the databases assignments, loops, conditionals are similar.

The main differences you should keep in mind when porting from Oracle’s PL/SQL to PostgreSQL’s PL/pgSQL

ClusterControl
Single Console for Your Entire Database Infrastructure
Find out what else is new in ClusterControl

Migration Tools

There are some tools which are very helpful for an Oracle to PostgreSQL migration. You can also create your own tool as an extension and use it inside PostgreSQL.

Orafce

Oracle compatible functions, data type and packages can be use as it is in PostgreSQL. This is an open source tool with BSD licence so anyone can use this tool.

Most of the major functions are covered in Orafce.

Applications usually use those functions with multiple occurrences. You can reduce the modification cost of SQL by using this tool.

All the functions and packages are implemented correctly and it is well tested.

Some of the functions:

  • Dbms_output
  • dbms_random
  • utl_file – filesystem related functions
  • Dbms_pipe and dbms_alert
  • PLVdate,PLVstr, PLVchr
  • Oracle compatible DATE data type and functions like ADD_MONTHS, LAST_DAY,NEXT_DAY and so on.
  • NVL function
  • SUBSTR and SUBSTRB function
  • VARCHAR2 and NVARCHAR2 support
  • TO_DATE()

Ora2pg

Ora2Pg is a free tool used to migrate an Oracle database to a PostgreSQL compatible schema.

It connects to the Oracle database, scans it automatically, extracts its structure or data and then generates SQL scripts that you can load into your PostgreSQL database.

The cost estimation in an Oracle to PostgreSQL migration is not easy.

Ora2Pg inspects all database objects, all functions and stored procedures to detect if there’s still some objects and PL/SQL code that cannot be automatically converted by Ora2Pg.

This tool is very helpful for the following conversions:

  • Schema conversion
  • PLSQL to PLPGSQL conversion

Testing

Testing the whole application and the migrated database is very important because some of the functions are the same in both databases, however the behaviour is different.

  • Some common scenarios need to be checked:
    • Check whether all the objects are correctly converted or not.
    • Check whether all the DMLS’s are working correctly or not.
    • Load some sample data in both databases and check the result. The result of SQL from both database should be same.
    • Check the performance of the DML and improve it if necessary.

An Overview of Logical Replication in PostgreSQL

$
0
0

PostgreSQL is one of the most advanced open source databases in the world with a lot of great features. One of them is Streaming Replication (Physical Replication) which was introduced in PostgreSQL 9.0. It is based on XLOG records which get transferred to the destination server and get applied there. However, it is cluster based and we cannot do a single database or single object (selective replication) replication. Over the years, we have been dependent on external tools like Slony, Bucardo, BDR, etc for selective or partial replication as there was no feature at the core level until PostgreSQL 9.6. However, PostgreSQL 10 came up with a feature called Logical Replication, through which we can perform database/object level replication.

Logical Replication replicates changes of objects based on their replication identity, which is usually a primary key. It is different to physical replication, in which replication is based on blocks and byte-by-byte replication. Logical Replication does not need an exact binary copy at the destination server side, and we have the ability to write on destination server unlike Physical Replication. This feature originates from the pglogical module.

In this blog post, we are going to discuss:

  • How it works - Architecture
  • Features
  • Use cases - when it is useful
  • Limitations
  • How to achieve it

How it Works - Logical Replication Architecture

Logical Replication implements a publish and subscribe concept (Publication & Subscription). Below is a higher level architectural diagram on how it works.

Basic Logical Replication Architecture

Publication can be defined on the master server and the node on which it is defined is referred to as the "publisher". Publication is a set of changes from a single table or group of tables. It is at database level and each publication exists in one database. Multiple tables can be added to a single publication and a table can be in multiple publications. You should add objects explicitly to a publication except if you choose the "ALL TABLES" option which needs a superuser privilege.

You can limit the changes of objects (INSERT, UPDATE, and DELETE) to be replicated. By default, all operation types are replicated. You must have a replication identity configured for the object that you want to add to a publication. This is in order to replicate UPDATE and DELETE operations. The replication identity can be a primary key or unique index. If the table does not have a primary key or unique index, then it can be set to replica identity "full" in which it takes all columns as key (entire row becomes key).

You can create a publication using CREATE PUBLICATION. Some practical commands are covered in the "How to achieve it" section.

Subscription can be defined on the destination server and the node on which it is defined is referred to as the "subscriber". The connection to the source database is defined in subscription. The subscriber node is the same as any other stand alone postgres database, and you can also use it as a publication to further subscriptions.

The subscription is added using CREATE SUBSCRIPTION and can be stopped/resumed at any time using the ALTER SUBSCRIPTION command and removed using DROP SUBSCRIPTION.

Once a subscription is created, Logical replication copies a snapshot of the data on the publisher database. Once that is done, it waits for delta changes and sends them to the subscription node as soon as they occur.

However, how are the changes collected? Who sends them to the target? And who applies them at the target? Logical replication is also based on the same architecture as physical replication. It is implemented by “walsender” and “apply” processes. As it is based on WAL decoding, who starts the decoding? The walsender process is responsible to start logical decoding of the WAL, and loads the standard logical decoding plugin (pgoutput). The plugin transforms the changes read from WAL to the logical replication protocol, and filters the data according to the publication specification. The data is then continuously transferred using the streaming replication protocol to the apply worker, which maps the data to local tables and applies the individual changes as they are received, in correct transactional order.

It logs all these steps in log files while setting it up. We can see the messages in "How to achieve it" section later in the post.

Features Of Logical Replication

  • Logical Replication replicates data objects based upon their replication identity (generally a
  • primary key or unique index).
  • Destination server can be used for writes. You can have different indexes and security definition.
  • Logical Replication has cross-version support. Unlike Streaming Replication, Logical Replication can be set between different versions of PostgreSQL (> 9.4, though)
  • Logical Replication does Event-based filtering
  • When compared, Logical Replication has less write amplification than Streaming Replication
  • Publications can have several subscriptions
  • Logical Replication provides storage flexibility through replicating smaller sets (even partitioned tables)
  • Minimum server load compared with trigger based solutions
  • Allows parallel streaming across publishers
  • Logical Replication can be used for migrations and upgrades
  • Data transformation can be done while setting up.

Use Cases - When is Logical Replication Useful?

It is very important to know when to use Logical Replication. Otherwise, you will not get much benefit if your use case does not match. So, here are some use cases on when to use Logical Replication:

  • If you want to consolidate multiple databases into a single database for analytical purposes.
  • If your requirement is to replicate data between different major versions of PostgreSQL.
  • If you want to send incremental changes in a single database or a subset of a database to other databases.
  • If giving access to replicated data to different groups of users.
  • If sharing a subset of the database between multiple databases.

Limitations Of Logical Replication

Logical Replication has some limitations on which the community is continuously working on to overcome:

  • Tables must have the same full qualified name between publication and subscription.
  • Tables must have primary key or unique key
  • Mutual (bi-directional) Replication is not supported
  • Does not replicate schema/DDL
  • Does not replicate sequences
  • Does not replicate TRUNCATE
  • Does not replicate Large Objects
  • Subscriptions can have more columns or different order of columns, but the types and column names must match between Publication and Subscription.
  • Superuser privileges to add all tables
  • You cannot stream over to the same host (subscription will get locked).

How to Achieve Logical Replication

Here are the steps to achieve basic Logical Replication. We can discuss about more complex scenarios later.

  1. Initialize two different instances for publication and subscription and start.

    C1MQV0FZDTY3:bin bajishaik$ export PATH=$PWD:$PATH
    C1MQV0FZDTY3:bin bajishaik$ which psql
    /Users/bajishaik/pg_software/10.2/bin/psql
    C1MQV0FZDTY3:bin bajishaik$ ./initdb -D /tmp/publication_db
    
    C1MQV0FZDTY3:bin bajishaik$ ./initdb -D /tmp/subscription_db
  2. Parameters to be changed before you start the instances (for both publication and subscription instances).

    C1MQV0FZDTY3:bin bajishaik$ tail -3 /tmp/publication_db/postgresql.conf
    listen_addresses='*'
    port = 5555
    wal_level= logical
    
    
    C1MQV0FZDTY3:bin bajishaik$ pg_ctl -D /tmp/publication_db/ start
    waiting for server to start....2018-03-21 16:03:30.394 IST [24344] LOG:  listening on IPv4 address "0.0.0.0", port 5555
    2018-03-21 16:03:30.395 IST [24344] LOG:  listening on IPv6 address "::", port 5555
    2018-03-21 16:03:30.544 IST [24344] LOG:  listening on Unix socket "/tmp/.s.PGSQL.5555"
    2018-03-21 16:03:30.662 IST [24345] LOG:  database system was shut down at 2018-03-21 16:03:27 IST
    2018-03-21 16:03:30.677 IST [24344] LOG:  database system is ready to accept connections
     done
    server started
    
    C1MQV0FZDTY3:bin bajishaik$ tail -3 /tmp/subscription_db/postgresql.conf
    listen_addresses='*'
    port=5556
    wal_level=logical
    
    C1MQV0FZDTY3:bin bajishaik$ pg_ctl -D /tmp/subscription_db/ start
    waiting for server to start....2018-03-21 16:05:28.408 IST [24387] LOG:  listening on IPv4 address "0.0.0.0", port 5556
    2018-03-21 16:05:28.408 IST [24387] LOG:  listening on IPv6 address "::", port 5556
    2018-03-21 16:05:28.410 IST [24387] LOG:  listening on Unix socket "/tmp/.s.PGSQL.5556"
    2018-03-21 16:05:28.460 IST [24388] LOG:  database system was shut down at 2018-03-21 15:59:32 IST
    2018-03-21 16:05:28.512 IST [24387] LOG:  database system is ready to accept connections
     done
    server started

    Other parameters can be at default for basic setup.

  3. Change pg_hba.conf file to allow replication. Note that these values are dependent on your environment, however, this is just a basic example (for both publication and subscription instances).

    C1MQV0FZDTY3:bin bajishaik$ tail -1 /tmp/publication_db/pg_hba.conf
     host     all     repuser     0.0.0.0/0     md5
    C1MQV0FZDTY3:bin bajishaik$ tail -1 /tmp/subscription_db/pg_hba.conf
     host     all     repuser     0.0.0.0/0     md5
    
    C1MQV0FZDTY3:bin bajishaik$ psql -p 5555 -U bajishaik -c "select pg_reload_conf()"
    Timing is on.
    Pager usage is off.
    2018-03-21 16:08:19.271 IST [24344] LOG:  received SIGHUP, reloading configuration files
     pg_reload_conf
    ----------------
     t
    (1 row)
    
    Time: 16.103 ms
    C1MQV0FZDTY3:bin bajishaik$ psql -p 5556 -U bajishaik -c "select pg_reload_conf()"
    Timing is on.
    Pager usage is off.
    2018-03-21 16:08:29.929 IST [24387] LOG:  received SIGHUP, reloading configuration files
     pg_reload_conf
    ----------------
     t
    (1 row)
    
    Time: 53.542 ms
    C1MQV0FZDTY3:bin bajishaik$
  4. Create a couple of test tables to replicate and insert some data on Publication instance.

    postgres=# create database source_rep;
    CREATE DATABASE
    Time: 662.342 ms
    postgres=# \c source_rep
    You are now connected to database "source_rep" as user "bajishaik".
    source_rep=# create table test_rep(id int primary key, name varchar);
    CREATE TABLE
    Time: 63.706 ms
    source_rep=# create table test_rep_other(id int primary key, name varchar);
    CREATE TABLE
    Time: 65.187 ms
    source_rep=# insert into test_rep values(generate_series(1,100),'data'||generate_series(1,100));
    INSERT 0 100
    Time: 2.679 ms
    source_rep=# insert into test_rep_other  values(generate_series(1,100),'data'||generate_series(1,100));
    INSERT 0 100
    Time: 1.848 ms
    source_rep=# select count(1) from test_rep;
     count
    -------
       100
    (1 row)
    
    Time: 0.513 ms
    source_rep=# select count(1) from test_rep_other ;
     count
    -------
       100
    (1 row)
    
    Time: 0.488 ms
    source_rep=#
  5. Create structure of the tables on Subscription instance as Logical Replication does not replicate the structure.

    postgres=# create database target_rep;
    CREATE DATABASE
    Time: 514.308 ms
    postgres=# \c target_rep
    You are now connected to database "target_rep" as user "bajishaik".
    target_rep=# create table test_rep_other(id int primary key, name varchar);
    CREATE TABLE
    Time: 9.684 ms
    target_rep=# create table test_rep(id int primary key, name varchar);
    CREATE TABLE
    Time: 5.374 ms
    target_rep=#
  6. Create publication on Publication instance (port 5555).

    source_rep=# CREATE PUBLICATION mypub FOR TABLE test_rep, test_rep_other;
    CREATE PUBLICATION
    Time: 3.840 ms
    source_rep=#
  7. Create subscription on Suscription instance (port 5556) to the publication created in step 6.

    target_rep=# CREATE SUBSCRIPTION mysub CONNECTION 'dbname=source_rep host=localhost user=bajishaik port=5555' PUBLICATION mypub;
    NOTICE:  created replication slot "mysub" on publisher
    CREATE SUBSCRIPTION
    Time: 81.729 ms

    From log:

    2018-03-21 16:16:42.200 IST [24617] LOG:  logical decoding found consistent point at 0/1616D80
    2018-03-21 16:16:42.200 IST [24617] DETAIL:  There are no running transactions.
    target_rep=# 2018-03-21 16:16:42.207 IST [24618] LOG:  logical replication apply worker for subscription "mysub" has started
    2018-03-21 16:16:42.217 IST [24619] LOG:  starting logical decoding for slot "mysub"
    2018-03-21 16:16:42.217 IST [24619] DETAIL:  streaming transactions committing after 0/1616DB8, reading WAL from 0/1616D80
    2018-03-21 16:16:42.217 IST [24619] LOG:  logical decoding found consistent point at 0/1616D80
    2018-03-21 16:16:42.217 IST [24619] DETAIL:  There are no running transactions.
    2018-03-21 16:16:42.219 IST [24620] LOG:  logical replication table synchronization worker for subscription "mysub", table "test_rep" has started
    2018-03-21 16:16:42.231 IST [24622] LOG:  logical replication table synchronization worker for subscription "mysub", table "test_rep_other" has started
    2018-03-21 16:16:42.260 IST [24621] LOG:  logical decoding found consistent point at 0/1616DB8
    2018-03-21 16:16:42.260 IST [24621] DETAIL:  There are no running transactions.
    2018-03-21 16:16:42.267 IST [24623] LOG:  logical decoding found consistent point at 0/1616DF0
    2018-03-21 16:16:42.267 IST [24623] DETAIL:  There are no running transactions.
    2018-03-21 16:16:42.304 IST [24621] LOG:  starting logical decoding for slot "mysub_16403_sync_16393"
    2018-03-21 16:16:42.304 IST [24621] DETAIL:  streaming transactions committing after 0/1616DF0, reading WAL from 0/1616DB8
    2018-03-21 16:16:42.304 IST [24621] LOG:  logical decoding found consistent point at 0/1616DB8
    2018-03-21 16:16:42.304 IST [24621] DETAIL:  There are no running transactions.
    2018-03-21 16:16:42.306 IST [24620] LOG:  logical replication table synchronization worker for subscription "mysub", table "test_rep" has finished
    2018-03-21 16:16:42.308 IST [24622] LOG:  logical replication table synchronization worker for subscription "mysub", table "test_rep_other" has finished

    As you can see in the NOTICE message, it created a replication slot which ensures the WAL cleanup should not be done until initial snapshot or delta changes are transferred to the target database. Then the WAL sender started decoding the changes, and logical replication apply worked as both pub and sub are started. Then it starts the table sync.

  8. Verify data on Subscription instance.

    target_rep=# select count(1) from test_rep;
     count
    -------
       100
    (1 row)
    
    Time: 0.927 ms
    target_rep=# select count(1) from test_rep_other ;
     count
    -------
       100
    (1 row)
    
    Time: 0.767 ms
    target_rep=#

    As you see, data has been replicated through initial snapshot.

  9. Verify delta changes.

    C1MQV0FZDTY3:bin bajishaik$ psql -d postgres -p 5555 -d source_rep -c "insert into test_rep values(generate_series(101,200), 'data'||generate_series(101,200))"
    INSERT 0 100
    Time: 3.869 ms
    C1MQV0FZDTY3:bin bajishaik$ psql -d postgres -p 5555 -d source_rep -c "insert into test_rep_other values(generate_series(101,200), 'data'||generate_series(101,200))"
    INSERT 0 100
    Time: 3.211 ms
    C1MQV0FZDTY3:bin bajishaik$ psql -d postgres -p 5556 -d target_rep -c "select count(1) from test_rep"
     count
    -------
       200
    (1 row)
    
    Time: 1.742 ms
    C1MQV0FZDTY3:bin bajishaik$ psql -d postgres -p 5556 -d target_rep -c "select count(1) from test_rep_other"
     count
    -------
       200
    (1 row)
    
    Time: 1.480 ms
    C1MQV0FZDTY3:bin bajishaik$

These are the steps for a basic setup of Logical Replication.

A Guide to Using pgBouncer for PostgreSQL

$
0
0

When reading PostgreSQL getting started, you see the line: “The PostgreSQL server can handle multiple concurrent connections from clients. To achieve this, it starts (“forks”) a new process for each connection. From that point on, the client and the new server process communicate without intervention by the original postgres process. Thus, the master server process is always running, waiting for client connections, whereas client and associated server processes come and go.

Brilliant idea. And yet it means that every new connection spins a new process, reserving RAM and possibly getting too heavy with multiple sessions. To avoid problems, postgres has max_connectionssetting with default 100 connections. Of course you can increase it, but such action would require restart (pg_settings.context is ‘postmaster’):

t=# select name,setting,short_desc,context from pg_settings where name = 'max_connections';
-[ RECORD 1 ]--------------------------------------------------
name       | max_connections
setting    | 100
short_desc | Sets the maximum number of concurrent connections.
context    | postmaster

And even after increasing - at some point you might need more connections (of course urgently as always on running prod). Why increasing it is so uncomfortable? Because if it was comfy, you would probably end up with uncontrolled spontaneous increasing of the number until the cluster starts lagging. Meaning old connections are slower - so they take more time, so you need even more and more new. To avoid such possible avalanche and add some flexibility, we have superuser_reserved_connections - to be able to connect and fix problems with SU when max_connections is exhausted. And we obviously see the need of some connection pooler. As we want new connection candidates to wait in a queue instead of failing with exception FATAL: sorry, too many clients already and not risking the postmaster.

Connection pooling is offered at some level by many popular “clients”. You could use it with jdbc for quite a while. Recently node-postgres offered it’s own node-pg-pool. More or less the implementation is simple (as the idea is): pooler starts the connections towards the database and keeps them. The client connecting to db only gets a “shared” existing connection and after closing it, the connection goes back to the pool. We also have much more sophisticated software, like pgPool. And yet pgbouncer is an extremely popular choice for the task. Why? Because it does only the pooling part, but does it right. It’s free. It’s fairly simple to set up. And you meet it at most biggest service providers as recommended or used, eg citusdata, aws, heroku and other highly respected resources.

So let us look closer at what it can and how you use it. In my setup I use default pool_mode = transaction ([pgbouncer] section) which is a very popular choice. This way we not just queue the connections exceeding max_connections, but rather reuse sessions without waiting for the previous connection to close:

[databases]
mon = host=1.1.1.1 port=5432 dbname=mon
mons = host=1.1.1.1 port=5432 dbname=mon pool_mode = session pool_size=2 max_db_connections=2
monst = host=1.1.1.1 port=5432 dbname=mon pool_mode = statement
[pgbouncer]
listen_addr = 1.1.1.1
listen_port = 6432
unix_socket_dir = /tmp
auth_file = /pg/pgbouncer/bnc_users.txt
auth_type = hba
auth_hba_file = /pg/pgbouncer/bnc_hba.conf
admin_users = root vao
pool_mode = transaction
server_reset_query = RESET ALL; --DEALLOCATE ALL; /* custom */
ignore_startup_parameters = extra_float_digits
application_name_add_host = 1
max_client_conn = 10000
autodb_idle_timeout = 3600
default_pool_size = 100
max_db_connections = 100
max_user_connections = 100
#server_reset_query_always = 1 #uncomment if you want older global behaviour

Short overview of the most popular settings and tips and tricks:

  • server_reset_query is very handy and important. In session pooling mode, it “wipes” previous session “artifacts”. Otherwise you would have problems with same names for prepared statements, session settings affecting next sessions and so on. The default is DISCARD ALL, that “resets” all session states. Yet you can choose more sophisticated values, e.g., RESET ALL; DEALLOCATE ALL; to forget only SET SESSION and prepared statements, keeping TEMP tables and plans “shared”. Or the opposite - you might want to make prepared statements “global” from any session. Such configuration is doable, though risky. You have to make pgbouncer reuse the session for all (thus making either very small pool size or avalanching the sessions), which is not completely reliable. Anyway - it is a useful ability. Especially in setups where you want client sessions to eventually (not immediately) change to configured pooled session settings. Very important point here is session pool mode. Before 1.6 this setting affected other pool modes as well, so if you relied on it, you need to use the new settingserver_reset_query_always = 1. Probably at some point people will want server_reset_query to be even more flexible and configurable per db/user pair (and client_reset_query instead). But as of current writing, March 2018, it’s not an option. The idea behind making this setting valid by default for session mode only was - if you share connection on transaction or statement level - you cannot rely on the session setting at all.

  • Auth_type = hba. Before 1.7, the big problem with pgbouncer was the absence of host based authentication - “postgres firewall”. Of course you still had it for postgres cluster connection, but pgbouncer was “open” for any source. Now we can use the same hba.conf to limit connections for host/db/user based on connection network.

  • connect_query is not performed on every client “connection” to pgbouncer, but rather when pgbouncer connects to a Postgres instance. Thus you can’t use it for setting or overriding “default” settings. In session mode, other sessions do not affect each other and on disconnect, reset query discards all - so you don’t need to mess with it. In transaction pooling mode, you would hope to use it for settings overriding erroneously set by other sessions, but it won’t work, alas. Eg. you want to share prepared statement between “sessions” in transaction mode, so you set something like

    trns = dbname=mon pool_mode = transaction connect_query = 'do $$ begin raise warning $w$%$w$, $b$new connection$b$; end; $$; prepare s(int) as select $1;'

    and indeed - every new client sees the prepared statements (unless you left server_reset_query_always to on, so pgbouncer discards it on commit). But if some client runs DISCARD s; in its session, it affects all clients on this connection and new clients connecting to it won’t see prepared statements anymore. But if you want to have some initial setting for postgres connections coming from pgbouncer, then this is the place.

  • application_name_add_host was added in 1.6, it has similar limitation. It “puts” the client IP to application_name, so you can easily get your bad query source, but is easily overridden by simple set application_name TO ‘wasn’’t me’; Still you can “heal” this using views - follow this post to get the idea or even use these short instructions. Basically idea is that show clients; will show the clients IP, so you can query it directly from pgbouncer database on each select from pg_stat_activity to check if it’s reset. But of course using a simple setting is much simpler and cosier. Though it does not guarantee the result...

  • pool_mode can be specified both as default, per database and per user - making it very flexible. Mixing modes makes pgbouncer extremely effective for pooling. This is a powerful feature, but one has to be careful when using it. Often users use it without understanding the results to absolutely atomic mixes of per transaction/per session/per user/per database/global settings working differently for the same user or database, due to the different pooling modes with pgbouncer. This is the box of matches you don’t give to children without supervision. Also many other options are configurable for default and per db and per user.

  • Please don’t take it literally, but you can “compare” different sections of ini with SET and ALTER: SET LOCAL affects transactions and is good to use when poll_mode=transaction , SET SESSION affects sessions and is safe for use when poll_mode=session , ALTER USER SET affects roles and will interfere with pgbouncer.ini part of section [users], ALTER DATABASE SET affects databases and will interfere with pgbouncer.ini part of section [databases], ALTER SYSTEM SET or editing postgres.conf globally affects defaults and is comparable by effect to the default section of pgbouncer.ini.

  • Once again - use pool mode responsibly. Prepared statements or session wide settings will be a mess in transaction pooling mode. Same as SQL transaction makes no sense in statement pooling mode. Choose a suitable pooling mode for suitable connections. A good practice is creating roles with the idea that:

    • some will run only fast selects, thus can share one session without transactions for a hundred of concurrent tiny not important selects.
    • Some role members are safe for session level concurrency, and ALWAYS use transactions. Thus they can safely share several sessions for hundreds of concurrent transactions.
    • Some roles are just too messy of complicated to share their session with others. So you use session pooling mode for them to avoid errors on connection when all “slots” are already taken.
  • Don’t use it instead of HAProxy or some other load balancer. Despite the fact that pgbouncer has several configurable features addressing what a load balancer addresses, like dns_max_ttl and you can set up a DNS configuration for it, most prod environments use HAProxy or some other load balancer for HA. This is because HAProxy is really good at load balancing across live servers in round robin fashion, better than pgbouncer. Although pgbouncer is better for postgres connection pooling, it might be better to use one small daemon that perfectly performs one task, instead of a bigger one that does two tasks, but worse.

  • Configuration changes can be tricky. Some changes to pgbouncer.ini require restart (listen_port and such), while others such as admin_users require reload or SIGHUP. Changes inside auth_hba_file require reload, while changes to auth_file do not.

The extremely short overview of settings above is limited by the format. I invite you to take a look at the complete list. Pgbouncer is the kind of software with very small amount of “boring settings” - they all have huge potential and are of amazing interest.

ClusterControl
Single Console for Your Entire Database Infrastructure
Find out what else is new in ClusterControl

And lastly, moving from a short enthusiastic review to something where you might be less happy - the installation. The process is clearly described in this section of documentation. The only option described is building from git sources. But everybody knows there are packages! Trying both most popular:

sudo yum install pgbouncer
sudo apt-get install pgbouncer

can work. But sometimes you have to do an extra step. E.g., when no pgbouncer package is available, try this.

Or even:

sudo yum install pgbouncer
Loaded plugins: priorities, update-motd, upgrade-helper
amzn-main                                                                                                                    | 2.1 kB  00:00:00
amzn-updates                                                                                                                 | 2.5 kB  00:00:00
docker-ce-edge                                                                                                               | 2.9 kB  00:00:00
docker-ce-stable                                                                                                             | 2.9 kB  00:00:00
docker-ce-test                                                                                                               | 2.9 kB  00:00:00
pgdg10                                                                                                                       | 4.1 kB  00:00:00
pgdg95                                                                                                                       | 4.1 kB  00:00:00
pgdg96                                                                                                                       | 4.1 kB  00:00:00
pglogical                                                                                                                    | 3.0 kB  00:00:00
sensu                                                                                                                        | 2.5 kB  00:00:00
(1/3): pgdg96/x86_64/primary_db                                                                                              | 183 kB  00:00:00
(2/3): pgdg10/primary_db                                                                                                     | 151 kB  00:00:00
(3/3): pgdg95/x86_64/primary_db                                                                                              | 204 kB  00:00:00
50 packages excluded due to repository priority protections
Resolving Dependencies
--> Running transaction check
---> Package pgbouncer.x86_64 0:1.8.1-1.rhel6 will be installed
--> Processing Dependency: libevent2 >= 2.0 for package: pgbouncer-1.8.1-1.rhel6.x86_64
--> Processing Dependency: c-ares for package: pgbouncer-1.8.1-1.rhel6.x86_64
--> Processing Dependency: libcares.so.2()(64bit) for package: pgbouncer-1.8.1-1.rhel6.x86_64
--> Running transaction check
---> Package c-ares.x86_64 0:1.13.0-1.5.amzn1 will be installed
---> Package pgbouncer.x86_64 0:1.8.1-1.rhel6 will be installed
--> Processing Dependency: libevent2 >= 2.0 for package: pgbouncer-1.8.1-1.rhel6.x86_64
--> Finished Dependency Resolution
Error: Package: pgbouncer-1.8.1-1.rhel6.x86_64 (pgdg10)
           Requires: libevent2 >= 2.0
 You could try using --skip-broken to work around the problem
 You could try running: rpm -Va --nofiles --nodigest

Of course adding pgdg to /etc/yum.repos.d/ won’t help anymore. Neither the --skip-broken or rpm -Va --nofiles --nodigest. A simple

sudo yum install libevent2
Loaded plugins: priorities, update-motd, upgrade-helper
50 packages excluded due to repository priority protections
No package libevent2 available.
Error: Nothing to do

would be too easy. So you have to build libevent2 yourself, bringing you back to the position when you have to compile things yourself. Either it is pgbouncer or one of its dependencies.

Again - digging too deep with the particularities of installation is out of scope. You should know you have a big chance to install it as package.

Lastly - questions like“why postgres does not offer a native session pooler” comes over and over. There are even very fresh suggestions and thoughts on it. But so far the most popular approach here is using pgbouncer.

Setting Up an Optimal Environment for PostgreSQL

$
0
0

Welcome to PostgreSQL, a powerful open source database system that can host anything from a few megabytes of customer data for a small-town-business, to hundreds of terabytes of ‘big data’ for multinational corporations. Regardless of the application, it’s likely that some setup and configuration help will be needed to get the database ready for action.

When a new server is installed, PostgreSQL’ s settings are very minimum as they are designed to run on the least amount of hardware possible. However they are very rarely optimal. Here, we will go over a basic setup for new projects, and how to set PostgreSQL up to run the most optimally on new projects.

Hosting

On-Premise Hosting

With an on-premise database, the best option is for a bare metal host, as Virtual Machines generally perform slower unless we’re talking about high end enterprise level VM’s. This also allows for tighter control over CPU, Memory, and Disk setups. This however comes with the need to have an expert on hand (or contract) to do server maintenance.

Cloud

Hosting a database in the cloud can be wonderful in some aspects, or a nightmare in others. Unless the cloud platform chosen is highly optimized (which generally means higher price), it may have trouble with higher load environments. Keep an eye out for whether or not the cloud server is shared or dedicated (dedicated allowing full performance from the server for the application), as well as the level of IOPS (Input/output Operations Per Second) provided by a cloud server. When (or if) the application grows to the point that the majority of data cannot be stored in memory, disk access speed is crucial.

General Host Setup

The main pillars needed to reliably set up PostgreSQL are based on the CPU, Memory, and Disk abilities of the host. Depending on the applications needs, a sufficient host as well as a well-tuned PostgreSQL configuration will have an amazing impact on the performance of the database system.

Choosing an Operating System

PostgreSQL can be compiled on most Unix-like operating systems, as well as Windows. However performance on Windows is not even comparable to a Unix-like system, so unless it’s for a small throw away project, sticking to an established Unix-like system will be the way to go. For this discussion, we’ll stick to Linux based systems.

The seemingly highest used Linux distribution used for hosting PostgreSQL is a Red Hat based system, such as CentOS or Scientific Linux, or even Red Hat itself. Since Red Hat and CentOS focus on stability and performance, the community behind these projects work hard to make sure important applications, such as databases, are on the most secure and most reliable build of Linux possible.

NOTE: Linux has a range of kernel versions that are not optimal for running PostgreSQL, so they are highly suggested to be avoided if possible (especially on applications where peak performance is the utmost importance). Benchmarks have shown that the number of transactions per second drop from kernel version 3.4 – 3.10, but recovers and significantly improves in kernel 3.12. This unfortunately rules out using CentOS 7 if going the CentOS route. CentOS 6 is still a valid and supported version of the Operating System, and CentOS 8 is expected to be released before 6 becomes unsupported.

Installation

Installation can be done either by source, or using repositories maintained by either the distribution of Linux chosen, or better yet, the PostgreSQL Global Development Group (PGDG), which maintains repositories for Red Hat based systems (Red Hat, Scientific Linux, CentOS, Amazon Linux AMI, Oracle Enterprise Linux, and Fedora), as well as packages for Debian and Ubuntu. Using the PGDG packages will ensure updates to PostgreSQL are available for update upon release, rather than waiting for the Linux distribution’s built in repositories to approve and provide them.

CPU

These days, it’s not hard to have multiple cores available for a database host. PostgreSQL itself has only recently started adding multi-threading capabilities on the query level, and will be getting much better in the years to come. But even without these new and upcoming improvements, PostgreSQL itself spawns new threads for each connection to the database by a client. These threads will essentially use a core when active, so number of cores required will depend on the level of needed concurrent connections and concurrent queries.

A good baseline to start out with is a 4 core system for a small application. Assuming applications do a dance between executing queries and sleeping, a 4 core system can handle a couple dozen connections before being overloaded. Adding more cores will help scale with an increasing workload. It’s not uncommon for very large PostgreSQL databases to have 48+ cores to serve many hundreds of connections.

Tuning Tips: Even if hyper-threading is available, transactions per second are generally higher when hyper-threading is disabled. For database queries that aren’t too complex, but higher in frequency, more cores is more important than faster cores.

Memory

Memory is an extremely important aspect for PostgreSQL’s overall performance. The main setting for PostgreSQL in terms of memory is shared_buffers, which is a chunk of memory allocated directly to the PostgreSQL server for data caching. The higher the likelihood of the needed data is living in memory, the quicker queries return, and quicker queries mean a more efficient CPU core setup as discussed in the previous section.

Queries also, at times, need memory to perform sorting operations on data before it’s returned to the client. This either uses additional ad-hoc memory (separate from shared_buffers), or temporary files on disk, which is much slower.

Tuning Tips: A basic starting point for setting shared_buffers is to set it to 1/4th the value of available system ram. This allows the operating system to also do its own caching of data, as well as any running processes other than the database itself.

Increasing work_mem can speed up sorting operations, however increasing it too much can force the host to run out of memory all together, as the value set can be partially or fully issued multiple times per query. If multiple queries request multiple blocks of memory for sorting, it can quickly add up to more memory than what is available on the host. Keep it low, and raise it slowly until performance is where desired.

Using the ‘free’ command (such as ‘free -h’), set effective_cache_size to a the sum of memory that’s free and cached. This lets the query planner know the level of OS caching may be available, and run better query plans.

Disk

Disk performance can be one of the more important things to consider when setting up a system. Input / Output speeds are important for large data loads, or fetching huge amounts of data to be processed. It also determines how quickly PostgreSQL can sync memory with disk to keep the memory pool optimal.

Some preparation in disks can help instantly improve potential performance, as well as future proof the database system for growth.

  • Separate disks

    A fresh install of PostgreSQL will create the cluster’s data directory somewhere on the main (and possibly only) available drive on the system.

    A basic setup using more drives would be adding a separate drive (or set of drives via RAID). It has the benefit of having all database related data transfer operating on a different I/O channel from the main operating system. It also allows the database to grow without fear of insufficient space causing issues and errors elsewhere in the operating system.

    For databases with an extreme amount of activity, the PostgreSQL Transaction Log (xlog) directory can be placed on yet another drive, separating more heavy I/O to another channel away from the main OS as well as the main data directory. This is an advanced measure that helps squeeze more performance out of a system, that may otherwise be near its limits.

  • Using RAID

    Setting up RAID for the database drives not only protects from data loss, it can also improve performance if using the right RAID configuration. RAID 1 or 10 are generally thought to be the best, and 10 offers parity and overall speed. RAID 5, however, while having higher levels of redundancy, suffers from significant performance decrease due to the way it spreads data around multiple disks. Plan out the best available option with plenty of space for data growth, and this will be a configuration that won’t need to be changed often, if at all.

  • Using SSD

    Solid State Drives are wonderful for performance, and if they meet the budget, enterprise SSD’s can make heavy data processing workloads night and day faster. Smaller to medium databases with smaller to medium workloads may be overkill, but when fighting for the smallest percentage increase on large applications, SSD can be that silver bullet.

Tuning Tips: Chose a drive setup that is best for the application at hand, and has plenty of space to grow with time as the data increases.

If using a SSD, setting random_page_cost to 1.5 or 2 (the default is 4) will be beneficial to the query planner, since random data fetching is much quicker than seen on spinning disks.

Initial Configuration Settings

When setting up PostgreSQL for the first time, there’s a handful of configuration settings that can be easily changed based on the power of the host. As the application queries the database over time, specific tuning can be done based on the application’s needs. However that will be the topic for a separate tuning blog.

Memory Settings

shared_buffers: Set to 1/4th of the system memory. If the system has less than 1 GB of total memory, set to ~ 1/8th of total system memory

work_mem: The default is 4MB, and may even be plenty for the application in question. But if temp files are being created often, and those files are fairly small (tens of megabytes), it might be worth upping this setting. A conservative entry level setting can be (1/4th system memory / max_connections). This setting depends highly on the actual behavior and frequency of queries to the database, so should be only increased with caution. Be ready to reduce it back to previous levels if issues occur.

effective_cache_size: Set to the sum of memory that’s free and cached reported by the ‘free’ command.

Checkpoint Settings

For PostgreSQL 9.4 and below:
checkpoint_segments: A number of checkpoint segments (16 megabytes each) to give the Write Ahead Log system. The default is 3, and can safely be increased to 64 for even small databases.

For PostgreSQL 9.5 and above:
max_wal_size: This replaced checkpoint_segments as a setting. The default is 1GB, and can remain here until needing further changes.

Security

listen_address: This setting determines what personal IP addresses / Network Cards to listen to connections on. In a simple setup, there will likely be only one, while more advanced networks may have multiple cards to connect to multiple networks. * Signifies listen to everything. However, if the application accessing the database is to live on the same host as the database itself, keeping it as ‘localhost’ is sufficient.

Logging

Some basic logging settings that won’t overload the logs are as follows.

log_checkpoints = on
log_connections = on
log_disconnections = on
log_temp_files = 0

Webinar Replay: How to Design Open Source Databases for High Availability

$
0
0

Thanks for joining this week’s webinar on how to design open source databases for high availability with Ashraf Sharif, Senior Support Engineer at Severalnines. From discussing high availability concepts through to failover or switch over mechanisms, Ashraf covered all the need-to-know information when it comes to building highly available database infrastructures.

It’s been said that not designing for failure leads to failure; but what is the best way to design a database system from the ground up to withstand failure?

Designing open source databases for high availability can be a challenge as failures happen in many different ways, which sometimes go beyond imagination. This is one of the consequences of the complexity of today’s open source database environments.

At Severalnines we’re big fans of high availability databases and have seen our fair share of failure scenarios across the thousands of database deployment attempts that we come across every year.

In this webinar replay, we look at the different types of failures you might encounter and what mechanisms can be used to address them. And we look at some of popular high availability solutions used today, and how they can help you achieve different levels of availability.

Watch the replay

Agenda

  • Why design for High Availability?
  • High availability concepts
    • CAP theorem
    • PACELC theorem
  • Trade offs
    • Deployment and operational cost
    • System complexity
    • Performance issues
    • Lock management
  • Architecting databases for failures
    • Capacity planning
    • Redundancy
    • Load balancing
    • Failover and switchover
    • Quorum and split brain
    • Fencing
    • Multi datacenter and multi-cloud setups
    • Recovery policy
  • High availability solutions
    • Database architecture determines Availability
    • Active-Standby failover solution with shared storage or DRBD
    • Master-slave replication
    • Master-master cluster
  • Failover and switchover mechanisms
    • Reverse proxy
    • Caching
    • Virtual IP address
    • Application connector

Watch the replay

Speaker

Ashraf Sharif is System Support Engineer at Severalnines. He was previously involved in hosting world and LAMP stack, where he worked as principal consultant and head of support team and delivered clustering solutions for large websites in the South East Asia region. His professional interests are on system scalability and high availability.


PostgreSQL Privileges and Security - Locking Down the Public Schema

$
0
0

Introduction

In a previous article we introduced the basics of understanding PostgreSQL schemas, the mechanics of creation and deletion, and reviewed several use cases. This article will extend upon those basics and explore managing privileges related to schemas.

More Terminology Overloading

But there is one preliminary matter requiring clarification. Recall that in the previous article, we dwelt on a possible point of confusion related to overloading of the term “schema”. The specialized meaning of that term in the context of PostgreSQL databases is distinct from how it is generally used in relational database management systems. We have another similar possible terminology kerfuffle for the present topic related to the word “public”.

Upon initial database creation, the newly created Postgresql database includes a pre-defined schema named “public”. It is a schema like any other, but the same word is also used as a keyword that denotes “all users” in contexts where otherwise an actual role name might be used, such as ... wait for it ... schema privilege management. The significance and two distinct uses will be clarified in examples below.

Querying Schema Privileges

Before making this concrete with example code to grant and revoke schema privileges, we need to review how to examine schema privileges. Using the psql command line interface, we list the schemas and associated privileges with the \dn+ command. For a newly-created sampledb database we see this entry for the public schema:

sampledb=# \dn+ 
                          List of schemas
  Name  |  Owner   |  Access privileges   |      Description      
--------+----------+----------------------+------------------------
 public | postgres | postgres=UC/postgres+| standard public schema
        |          | =UC/postgres         |
(1 row)

The first two and the fourth columns are pretty straightforward: as mentioned previously showing the default-created schema named “public”, described as “standard public schema”, and owned by the role “postgres”. (The schema ownership, unless specified otherwise, is set to the role which creates the schema.) That third column listing the access privileges is of interest here. The format of the privilege information provides three items: the privilege grantee, the privileges, and privilege grantor in the format “grantee=privileges/grantor” that is, to the left of the equality sign is the role receiving the privilege(s), immediately to the right of the equality sign is a group of letters specifying the particular privilege(s), and lastly following the slash the role which granted to privilege(s). There may be multiple such privilege information specifications, listed separated by a plus sign since privileges are additive.

For schemas, there are two possible privileges which may be granted separately: U for “USAGE” and C for “CREATE”. The former is required for a role to have the ability to lookup database objects such as tables and views contained in the schema; the latter privilege allows for a role to create database objects in the schema. There are other letters for other privileges relating to different types of database objects, but for schemas, only U and C apply.

Thus to interpret the privilege listing above, the first specification tells us that the postgres user was granted the update and create privileges by itself on the public schema.

Notice that for the second specification above, an empty string appears to the left of the equal sign. This is how privileges granted to all users, by means of the PUBLIC key word mentioned earlier, is denoted.

This latter specification of granting usage and create privileges on the public schema to all users is viewed by some as possibly contrary to general security principles best practices, where one might prefer to start with access restricted by default, requiring the database administrator to explicitly grant appropriate and minimally necessary access privileges. These liberal privileges on the public schema are purposely configured in the system as a convenience and for legacy compatibility.

Note also that except for the permissive privilege settings, the only other thing special about the public schema is that it also listed in the search_path, as we discussed in the previous article. This is similarly for convenience: The search_path configuration and liberal privileges together result in a new database being usable as if there was no such concept as schemas.

Historical Background on the Public Schema

This compatibility concern originates from about fifteen years ago (prior to PostgreSQLversion 7.3, cf. version 7.3 release notes) when the schema feature was not part of PostgreSQL. Configuration of the public schema with liberal privileges and the search_path presence when schemas were introduced in version 7.3 allowed for compatibility of older applications, which are not schema-aware, to function unmodified with the upgraded database feature.

Otherwise there is nothing else particularly special about the public schema: some DBA’s delete it if their use case presents no requirement for it; others lock it down by revoking the default privileges.

Show Me the Code - Revoking Privileges

Let’s do some code to illustrate and expand on what we have discussed so far.

Schema privileges are managed with the GRANT and REVOKE commands to respectively add and withdraw privileges. We’ll try some specific examples for locking down the public schema, but the general syntax is:

REVOKE [ GRANT OPTION FOR ]
    { { CREATE | USAGE } [, ...] | ALL [ PRIVILEGES ] }
    ON SCHEMA schema_name [, ...]
    FROM { [ GROUP ] role_name | PUBLIC } [, ...]
    [ CASCADE | RESTRICT ]

So, as an initial lock down example, let’s remove the create privilege from the public schema. Note that in these examples the lowercase word “public” refers to the schema and could be replaced by any other valid schema name that might exist in the database. The uppercase “PUBLIC” is the special keyword that implies “all users” and could instead be replaced with a specific role name or comma-separated list of role names for more fine-grained access control.

sampledb=# REVOKE CREATE ON SCHEMA public FROM PUBLIC;
REVOKE
sampledb=# \dn+
                          List of schemas
  Name  |  Owner   |  Access privileges   |      Description       
--------+----------+----------------------+------------------------
 public | postgres | postgres=UC/postgres+| standard public schema
        |          | =U/postgres          | 
(1 row)

The only difference in this listing of schema privileges from the first is the absence of the “C” in the second privilege specification, verifying our command was effective: users other than the postgres user may no longer create tables, views, or other objects in the public schema.

Note that the above command revoking create privileges from the public schema is the recommended mitigation for a recently published vulnerability, CVE-2018-1058, which arises from the default privilege setting on the public schema.

A further level of lock down could entail denying lookup access to the schema entirely by removing the usage privilege:

sampledb=# REVOKE USAGE ON SCHEMA public FROM PUBLIC;
REVOKE
sampledb=# \dn+
                          List of schemas
  Name  |  Owner   |  Access privileges   |      Description       
--------+----------+----------------------+------------------------
 public | postgres | postgres=UC/postgres | standard public schema
(1 row)

Since all available schema privileges for non-owner users have been revoked, the entire second privilege specification disappears in the listing above.

What we did with two separate commands could have been succinctly accomplished with a single command specifying all privileges as:

sampledb=# REVOKE ALL PRIVILEGES ON SCHEMA public FROM PUBLIC;
REVOKE

Additionally, it is also possible to revoke privileges from the schema owner:

sampledb=# REVOKE ALL PRIVILEGES ON SCHEMA public FROM postgres;
REVOKE
sampledb=# \dn+
                        List of schemas
  Name  |  Owner   | Access privileges |      Description       
--------+----------+-------------------+------------------------
 public | postgres |                   | standard public schema
(1 row)

but that does not really accomplish anything practical, as the schema owner retains full privileges to owned schemas regardless of explicit assignment simply by virtue of ownership.

The liberal privilege assignment for the public schema is a special artifact associated with initial database creation. Subsequently-created schemas in an existing database do conform with the best practice of starting without assigned privileges. For example, examining schema privileges after creating a new schema named “private” shows the new schema has no privileges:

sampledb=# create schema private;
CREATE SCHEMA
sampledb=# \dn+
                          List of schemas
  Name   |  Owner   |  Access privileges   |      Description       
---------+----------+----------------------+------------------------
 private | postgres |                      | 
 public  | postgres |                      | standard public schema
(2 rows)
ClusterControl
Single Console for Your Entire Database Infrastructure
Find out what else is new in ClusterControl

Show Me the Code - Granting Privileges

The general form of the command to add privileges is:

GRANT { { CREATE | USAGE } [, ...] | ALL [ PRIVILEGES ] }
    ON SCHEMA schema_name [, ...]
    TO role_specification [, ...] [ WITH GRANT OPTION ]
where role_specification can be:
  [ GROUP ] role_name
  | PUBLIC
  | CURRENT_USER
  | SESSION_USER

Using this command we can, for example, allow all roles to lookup database objects in the private schema by adding the usage privilege with

sampledb=# GRANT USAGE ON SCHEMA private TO PUBLIC;
GRANT
sampledb=# \dn+
                          List of schemas
  Name   |  Owner   |  Access privileges   |      Description       
---------+----------+----------------------+------------------------
 private | postgres | postgres=UC/postgres+| 
         |          | =U/postgres          | 
 public  | postgres |                      | standard public schema
(2 rows)

Note how the UC privileges appear for the postgres owner as the first specification, now that we have assigned other-than-default privileges to the schema. The second specification, =U/postgres, corresponds to the GRANT command we just invoked as user postgres granting usage privilege to all users (where, recall, the empty string left of the equal sign implies “all users”).

A specific role, named “user1” for example, can be granted both create and usage privileges to the private schema with:

sampledb=# GRANT ALL PRIVILEGES ON SCHEMA private TO user1;
GRANT
sampledb=# \dn+
                          List of schemas
  Name   |  Owner   |  Access privileges   |      Description       
---------+----------+----------------------+------------------------
 private | postgres | postgres=UC/postgres+| 
         |          | =U/postgres         +| 
         |          | user1=UC/postgres    | 
 public  | postgres |                      | standard public schema
(2 rows)

We have not yet mentioned the “WITH GRANT OPTION” clause of the general command form. Just as it sounds, this clause permits a granted role the power to itself grant the specified privilege to other users, and it is denoted in the privilege listing by asterisks appended to the specific privilege:

sampledb=# GRANT ALL PRIVILEGES ON SCHEMA private TO user1 WITH GRANT OPTION;
GRANT
sampledb=# \dn+
                          List of schemas
  Name   |  Owner   |  Access privileges   |      Description       
---------+----------+----------------------+------------------------
 private | postgres | postgres=UC/postgres+| 
         |          | =U/postgres         +| 
         |          | user1=U*C*/postgres  | 
 public  | postgres |                      | standard public schema
(2 rows)

Conclusion

This wraps up the topic for today. As a final note, though, remember that we have discussed only schema access privileges. While the USAGE privilege allows lookup of database objects in a schema, to actually access the objects for specific operations, such as reading, writing, execution, and etc., the role must also have appropriate privileges for those operations on those specific database objects.

New Webinar: How to Measure Database Availability

$
0
0

Join us on April 24th for Part 2 of our database high availability webinar special!

In this session we will focus on how to measure database availability. It is notoriously hard to measure and report on, although it is an important KPI in any SLA between you and your customer. With that in mind, we will discuss the different factors that affect database availability and see how you can measure your database availability in a realistic way.

It is common enough to define availability in terms of 9s (e.g. 99.9% or 99.999%) - especially here at Severalnines - although there are often different opinions as to what these numbers actually mean, or how they are measured.

Is the database available if an instance is up and running, but it is unable to serve any requests? Or if response times are excessively long, so that users consider the service unusable? Is the impact of one longer outage the same as multiple shorter outages? How do partial outages affect database availability, where some users are unable to use the service while others are completely unaffected?

Not agreeing on precise definitions with your customers might lead to dissatisfaction. The database team might be reporting that they have met their availability goals, while the customer is dissatisfied with the service.

Join us for this webinar during which we will discuss the different factors that affect database availability and see how to measure database availability in a realistic way.

Register for the webinar

Date, Time & Registration

Europe/MEA/APAC

Tuesday, April 24th at 09:00 BST / 10:00 CEST (Germany, France, Sweden)

Register Now

North America/LatAm

Tuesday, April 24th at 09:00 PDT (US) / 12:00 EDT (US)

Register Now

Agenda

  • Defining availability targets
    • Critical business functions
    • Customer needs
    • Duration and frequency of downtime
    • Planned vs unplanned downtime
    • SLA
  • Measuring the database availability
    • Failover/Switchover time
    • Recovery time
    • Upgrade time
    • Queries latency
    • Restoration time from backup
    • Service outage time
  • Instrumentation and tools to measure database availability:
    • Free & open-source tools
    • CC's Operational Report
    • Paid tools

Register for the webinar

Speaker

Bartlomiej Oles is a MySQL and Oracle DBA, with over 15 years experience in managing highly available production systems at IBM, Nordea Bank, Acxiom, Lufthansa, and other Fortune 500 companies. In the past five years, his focus has been on building and applying automation tools to manage multi-datacenter database environments.

My Favorite PostgreSQL Queries and Why They Matter

$
0
0

Databases, tables, normalization, and a solid backup plan allow us to store and maintain data.

Those combined best practices, in turn, afford us interaction with that data. In today's data-driven world, data is valuable. Not only valuable, data is oftentimes critical to end-user solutions provided by products and services. Extracting insight, answering questions, and meaningful metrics from data by way of querying and data manipulation is an integral component of SQL in general.

PostgreSQL is no different.

This foundational crux is critical for success in any data-driven aspect.

Below, I present a combination of 8 differing queries or types of queries I have found interesting and engaging to explore, study, learn, or otherwise manipulate data sets.

They are not listed in any order of importance.

Most will probably be familiar old friends. Perhaps some will become new acquaintances.

Sample tables and data used are not as important as the actual construction of the queries themselves and what each query returns, offers, or provides. Many of them are mock and derived for demonstration purposes and should not be taken literally in their values.

1. Left join, mind any nulls on the right...

Suppose in this example, we have a running sale of two months and are getting a total of both combined.

Yet, for some reason, the second month did not pull its weight and we want to target what days month one picked up the slack.

These sales are represented as tables payment and fake_month for this demonstration.

To note:

  • We will only check for totals greater than 2000.
  • We will limit the output to just 10 rows.

To start, we have this Common Table Expression (CTE) 'generating' the fake_month table for us, and query that follows.

dvdrental=> WITH fake_month AS(
SELECT setup::date
FROM generate_series('2007-02-01', '2007-02-28', INTERVAL '1 day') AS setup
)
SELECT date_part('day', p.payment_date)::INT AS legit,
SUM(p.amount),
date_part('day', fk.setup)::INT AS fake
FROM payment AS p
LEFT JOIN fake_month AS fk
ON date_part('day', fk.setup)::INT = date_part('day', p.payment_date)::INT
GROUP BY legit, fake
HAVING SUM(p.amount) > 2000
LIMIT 10;
legit | sum | fake
-------+---------+------
1 | 2808.24 | 1
2 | 2550.05 | 2
6 | 2077.14 | 6
8 | 2227.84 | 8
9 | 2067.86 | 9
17 | 3630.33 | 17
18 | 3977.74 | 18
19 | 3908.59 | 19
20 | 3888.98 | 20
21 | 3786.14 | 21
(10 rows)

Looks as if both months contributed there. So is this solved?

Before we consider this solved, let's visit the ORDER BY clause.

Of course, you can ORDER BY ASC or DESC.

However, you can also ORDER BY NULLS first or last and that changes things up a bit.

Let's rewrite this query and use ORDER BY NULLS first on the legit column.

For brevity, I'll remove the CTE from the output, just know it is still there and being used.

SELECT date_part('day', p.payment_date)::INT AS legit,
SUM(p.amount),
date_part('day', fk.setup)::INT AS fake
FROM payment AS p
LEFT JOIN fake_month AS fk
ON date_part('day', fk.setup)::INT = date_part('day', p.payment_date)::INT
GROUP BY legit, fake
HAVING SUM(p.amount) > 2000
ORDER BY legit NULLS first
LIMIT 10;
legit | sum | fake
-------+---------+------
1 | 2808.24 | 1
2 | 2550.05 | 2
6 | 2077.14 | 6
8 | 2227.84 | 8
9 | 2067.86 | 9
17 | 3630.33 | 17
18 | 3977.74 | 18
19 | 3908.59 | 19
20 | 3888.98 | 20
21 | 3786.14 | 21
(10 rows)

No difference there at all.

What if we ORDER BY NULLS first on the fake column? The one on the right side of the JOIN?

Let's see.

SELECT date_part('day', p.payment_date)::INT AS legit,
SUM(p.amount),
date_part('day', fk.setup)::INT AS fake
FROM payment AS p
LEFT JOIN fake_month AS fk
ON date_part('day', fk.setup)::INT = date_part('day', p.payment_date)::INT
GROUP BY legit, fake
HAVING SUM(p.amount) > 2000
ORDER BY fake NULLS first
LIMIT 10;
legit | sum | fake
-------+---------+------
29 | 2717.60 |
30 | 5723.89 |
1 | 2808.24 | 1
2 | 2550.05 | 2
6 | 2077.14 | 6
8 | 2227.84 | 8
9 | 2067.86 | 9
17 | 3630.33 | 17
18 | 3977.74 | 18
19 | 3908.59 | 19
(10 rows)

Now we are getting somewhere. We can see for days 29 & 30, the fake column has been ordered from the top of the results set.

Due to ORDER BY fake NULLS first.

This solves our question, to what days 'sale 2' slacked off.

Are you wondering...

"Can we just filter with WHERE fake IS NULL?"

Like this:

SELECT date_part('day', p.payment_date)::INT AS legit,
SUM(p.amount),
date_part('day', fk.setup)::INT AS fake
FROM payment AS p
LEFT JOIN fake_month AS fk
ON date_part('day', fk.setup)::INT = date_part('day', p.payment_date)::INT
WHERE date_part('day', fk.setup) IS NULL
GROUP BY legit, fake
HAVING SUM(p.amount) > 2000
LIMIT 10;
legit | sum | fake
-------+---------+------
29 | 2717.60 |
30 | 5723.89 |
(2 rows)

Yes that works. So why not just use that query instead? Why it matters?

I feel using LEFT JOIN and ORDER BY NULLS first for the table on the right side of the JOIN, is a great way to explore unfamiliar tables and data sets.

By confirming what, if any, data is ‘missing’ on that side of the join condition first; enhances clarity and awareness, allowing you to then filter out the results set with the WHERE <column_name> IS NULL clause, finalizing things up.

Of course, familiarity with the tables and datasets could potentially eliminate the need for the LEFT JOIN presented here.

It's a worthy query for anyone utilizing PostgreSQL to at least try, during exploration.

2. String Concatenation

Concatenation, the joining or appending of two strings, provides a presentation option for results sets. Many 'things' can be concatenated.

However, as noted in the documentation, the string concatenation operator ('||') accepts non-string input, as long as one is a string.

Let' see some examples with the below queries:

postgres=> SELECT 2||' times'||' 2 equals: '|| 2*2;
?column?
---------------------
2 times 2 equals: 4
(1 row)

We can see, numbers and strings all can be concatenated together as mentioned above.

The '||' operator is but one of those available in PostgreSQL.

The concat() function accepts multiple arguments, concatenating them all on return.

Here's an example of that function in action:

postgres=> SELECT concat('Josh ','Otwell') AS first_name;
first_name
-------------
Josh Otwell
(1 row)

We can pass in more than two arguments if desired:

postgres=> SELECT concat('Josh','','Otwell') AS first_name;
first_name
-------------
Josh Otwell
(1 row)

Let's note something real quick with these next examples:

postgres=> SELECT CONCAT('Josh',NULL,'Otwell') AS first_name;
first_name
------------
JoshOtwell
(1 row)
postgres=> SELECT 'Josh '||NULL||'Otwell' AS first_name;
first_name
------------
(1 row)
postgres=> SELECT NULL||'Josh '||'Otwell' AS first_name;
first_name
------------
(1 row)
postgres=> SELECT CONCAT(NULL,'Josh','Otwell') AS first_name;
first_name
------------
JoshOtwell
(1 row)

Observe that the concat() function ignores NULL no matter where placed in the list of parameters, while the string concatenation operator does not.

NULL is returned if present anywhere in the string to concatenate.

Just be aware of that.

Instead of manually including within the string to be concatenated, PostgreSQL also includes a concat_ws() function that accepts a string separator as the first parameter.

We will visit it with these queries:

postgres=> SELECT concat_ws('-',333,454,1919) AS cell_num;
cell_num
--------------
333-454-1919
(1 row)
postgres=> SELECT concat_ws('','Josh','Otwell') AS first_name;
first_name
-------------
Josh Otwell
(1 row)

concat_ws() accepts either numbers or strings as arguments and as stated above, uses the first argument as the separator.

How does concat_ws() treat NULL?

postgres=> SELECT concat_ws('-',333,NULL,1919) AS cell_num;
cell_num
----------
333-1919
(1 row)
postgres=> SELECT concat_ws(NULL,333,454,1919) AS cell_num;
cell_num
----------
(1 row)

NULL is ignored unless it is the separator argument given to concat_ws().

Then, all arguments are ignored and NULL is returned instead.

Concatenation is cool...

Now that we have an idea of how concatenation works, let's look at a couple of examples of it.

Back to the mock DVD rental database

Suppose we need to compile a list of customers first and last names, along with their email address to send out a memo for updating their account.

I will limit the output to just 10 rows for brevity's sake, but still demonstrating the || operator.

dvdrental=> SELECT first_name||''||last_name||'''s email address is: '||email AS name_and_email
FROM customer
LIMIT 10;
name_and_email
--------------------------------------------------------------------------
Jared Ely's email address is: jared.ely@sakilacustomer.org
Mary Smith's email address is: mary.smith@sakilacustomer.org
Patricia Johnson's email address is: patricia.johnson@sakilacustomer.org
Linda Williams's email address is: linda.williams@sakilacustomer.org
Barbara Jones's email address is: barbara.jones@sakilacustomer.org
Elizabeth Brown's email address is: elizabeth.brown@sakilacustomer.org
Jennifer Davis's email address is: jennifer.davis@sakilacustomer.org
Maria Miller's email address is: maria.miller@sakilacustomer.org
Susan Wilson's email address is: susan.wilson@sakilacustomer.org
Margaret Moore's email address is: margaret.moore@sakilacustomer.org
(10 rows)

Notice we had to escape the single quote used with apostrophe s, using an additional single quote to show possession of the email address for each customer.

Why you should know?

There may be times when concatenating data presents you with better insight and understanding into the data set you are working with. Along with reporting options, concatenating shared datasets with others' could potentially make them (the data) more readable and digestible.

3. Supplying IN values list with Subquery's

A Subquery has numerous powerful uses. Of those, providing an IN list of values to check for membership is a common one.

Here's a quick use.

Suppose we have customer and payments tables in a mock DVD rental store and want to reward our top five highest spending customers who rented movies during the days of April 10 - 13.

Imagine that's a special target period. So if the customer spent more than $30, we want to acknowledge them.

Bear in mind, there are other available options for solving this type of question (i.e., joins, capturing results from multiple selects, etc...), yet, sub-queries can handle it as well.

We will start out with the whole shebang here. This complete query returns everything we want for this particular question.

dvdrental=> SELECT first_name, last_name, email
FROM customer
WHERE customer_id IN (
SELECT customer_id FROM (
SELECT DISTINCT customer_id, SUM(amount)
FROM payment
WHERE extract(month from payment_date) = 4
AND extract(day from payment_date) BETWEEN 10 AND 13
GROUP BY customer_id
HAVING SUM(amount) > 30
ORDER BY SUM(amount) DESC
LIMIT 5) AS top_five);

This example actually contains nested subquery's, one of which is a Derived Table.

Let's start by drilling into the innermost subquery, that Derived Table.

This subquery is a standalone SELECT statement all its own, returning a customer_id and a SUM() on the amount column.

Only those customers meeting the criteria checked by the WHERE and HAVING clauses make the cut, being further thinned out with LIMIT 5;

Why the next subquery you ask?

Can we not just use the WHERE customer_id IN portion of the outermost SELECT here?

Let's see with a hands-on approach.

I will remove the AS top_five from the subquery and try the outermost query with it now:

dvdrental=> SELECT first_name, last_name, email
FROM customer
WHERE customer_id IN
(SELECT DISTINCT customer_id, SUM(amount)
FROM payment
WHERE extract(month from payment_date) = 4
AND extract(day from payment_date) BETWEEN 10 AND 13
GROUP BY customer_id
HAVING SUM(amount) > 30
ORDER BY SUM(amount) DESC
LIMIT 5);
ERROR: subquery has too many columns
LINE 3: WHERE customer_id IN (

Here, IN membership is being tested with only the customer_id column, yet the Derived Table returns two columns and PostgreSQL lets us know.

One remedy is to use another subquery. Selecting only the customer_id from the Derived Table results set, creates the next inner nested subquery.

Now the IN predicate contains multiple rows of one column's values to check membership against the WHERE clause for customer_id to make the final results set.

Why it matters?

Utilizing subquery's in this manner is powerful due to the fact of the number of values that could potentially be tested with the IN() predicate.

Imagine if there were a 100? Or more?

'Hard-coding' all of them in the IN() list could become problematic and error-prone as the volume of values increases.

4. generate_series()

This set returning function, is handy and super fun to use and explore. I have used generate_series() in above examples, but it deserves a talk of its own. Focusing more on the function and capabilities.

I find generate_series() useful for comparative queries where some, or all data is missing.

Or only partial data is available at the time I am exploring. One handy use is populating tables with 'dummy data'.

To start, we will create a simple table:

trial=> CREATE TABLE tbl_1(
trial(> tb_id SERIAL PRIMARY KEY,
trial(> some_day DATE,
trial(> an_amt NUMERIC(4,2));
CREATE TABLE

Then use generate_series() as the VALUES for our INSERT statement:

trial=> INSERT INTO tbl_1(some_day, an_amt)
VALUES(
generate_series('2018-04-01','2018-04-15',INTERVAL '1 day'),
generate_series(2.43, 34.20, 1.03));
INSERT 0 31

Then create a second table

trial=> CREATE TABLE tbl_2(
tb2_id SERIAL PRIMARY KEY,
some_day2 DATE,
an_amt2 NUMERIC(4,2));
CREATE TABLE

Also, populate it using generate_series() in the INSERT statement:

trial=> INSERT INTO tbl_2(some_day2, an_amt2)
VALUES(
generate_series('2018-05-16','2018-05-31',INTERVAL '1 day'),
generate_series(15.43, 31., 1.03));
INSERT 0 16

Why it matters?

To reiterate, generate_series() is so useful for creating mock or practice data.

I have found mimicking month or day ranges for comparison is exceptional with generate_series(). Refer to section 1 and the CTE there, demonstrates this use.

Creating a set of complete data with generate_series() and using to compare against stored data to determine if any data is missing holds great value as well.

5. Query's with the COUNT() aggregate function.

This simple, yet effective aggregate function should be in anyone's arsenal. Especially when exploring tables or data sets for the first time.

I mean, do you really want to 'SELECT everything' from a table with 1M rows?

Determine with COUNT(*) how many records are present before you load up.

Let's find out how many rows the film table has in this mock DVD rental table:

dvdrental=> SELECT COUNT(*)
dvdrental-> FROM film;
count
-------
1000
(1 row)

While not quite as extensive as 1M+ rows, I'm sure you see the usefulness.

To return the number of specific rows, COUNT(*) can be filtered with a WHERE clause.

Let's see how many films have a 'G' rating:

dvdrental=> SELECT COUNT(*)
dvdrental-> FROM film
dvdrental-> WHERE rating = 'G';
count
-------
178
(1 row)

There is another form of COUNT() to be aware of. COUNT(some_expression).

The differences between them are:

  • COUNT(*) returns the total of all input rows (including NULLS and duplicates).
  • COUNT(some_expression) counts the number of non-NULL input rows.

When used in conjunction with the DISTINCT keyword, COUNT() will eliminate duplicate entries and return only unique values.

Let's see that in action using COUNT() with DISTINCT to determine how many unique types of ratings are present:

dvdrental=> SELECT COUNT(DISTINCT rating) FROM film;
count
-------
5
(1 row)

With this query, we know there are 5 types of ratings.

Why it matters?

Depending on what is being tracked or targeted, knowing how many of something exists can be important. Therefore, utilizing COUNT(*) or COUNT(some_expression) assists with these types of challenges.

Just remember COUNT(*) does not ignore NULL. All rows, duplicate and NULL values included, are returned as part of the final number.

6. UPDATE multiple rows with a CASE expression.

Suppose we have this table:

trial=> SELECT * FROM reward_members;
rm_id | expense_amt | member_status
-------+-------------+---------------
1 | 1245.33 | gold
2 | 1300.49 | gold
3 | 900.20 | bronze
4 | 2534.44 | platinum
5 | 600.19 | bronze
6 | 1001.55 | silver
7 | 1097.99 | silver
8 | 3033.33 | platinum
(8 rows)

We need to rename the member_status column and add 'group' to the end of the current name present for each record.

For starters, multiple individual UPDATE statements will accomplish this no problem.

But, so can a single CASE expression.

trial=> UPDATE reward_members
SET member_status = (
CASE member_status
WHEN 'gold' THEN 'gold_group'
WHEN 'bronze' THEN 'bronze_group'
WHEN 'platinum' THEN 'platinum_group'
WHEN 'silver' THEN 'silver_group'
END
)
WHERE member_status IN ('gold', 'bronze','platinum', 'silver');
UPDATE 8

Let's query the table again to see the changes:

trial=> SELECT * FROM reward_members;
rm_id | expense_amt | member_status
-------+-------------+----------------
1 | 1245.33 | gold_group
2 | 1300.49 | gold_group
3 | 900.20 | bronze_group
4 | 2534.44 | platinum_group
5 | 600.19 | bronze_group
6 | 1001.55 | silver_group
7 | 1097.99 | silver_group
8 | 3033.33 | platinum_group
(8 rows)

All update were successful.

Why it matters?

You can imagine how many round trips this would take to the server if multiple individual UPDATE statements had been run. In truth, only 4 for this example. But still, the potential for many is always there.

Yet, using an UPDATE with CASE expression, we are sending only one query instead.

7. COPY and \copy

PostgreSQL provides COPY, a command for exporting data between files and tables.

Be sure and visit the provided link to see the abundant number of options available with COPY.

An important note concerning COPY. SUPERUSER role privilege is required to execute this command.

The psql meta-command \copy is an alternative for those users not deemed this role attribute. We will visit that command in turn shortly.

First, let's run a COPY command to export certain columns to a CSV file on the local machine.

Assume we have this query result to for export:

trial=# SELECT expense_amt, member_status
trial-# FROM reward_members
trial-# WHERE member_status = 'gold_group';
expense_amt | member_status
-------------+---------------
1245.33 | gold_group
1300.49 | gold_group
(2 rows)

With COPY, we can use that SELECT statement to complete this export.

trial=# COPY (SELECT expense_amt, member_status
FROM reward_members
WHERE member_status = 'gold_group')
TO '/home/linux_user_here/awards_to_honor.csv'
DELIMITER ','
CSV HEADER;
COPY 2

*Note: Per the documentation, the query must be within parenthesis.

Let's now check the contents of that file:

$ cat awards_to_honor.csv
expense_amt,member_status
1245.33,gold_group
1300.49,gold_group

We can see the first line contains the HEADER (which are the column names) and both lines have the expense_amt and member_status data for both columns returned from the WHERE clause filter.

Another important caveat I discovered from executing the above COPY command.

The user must have privileges to write to the file at the OS level.

In my case, fixed with:

$ sudo chown postgres awards_to_honor.csv

You can avoid this issue by instead writing to a system file the current user has access to such as /tmp (shown below.)

trial=# COPY (SELECT expense_amt, member_status
FROM reward_members
WHERE member_status = 'gold_group')
TO '/tmp/awards_to_honor.csv'
DELIMITER ','
CSV HEADER;
COPY 2

However, one of my test roles without the SUPERUSER attribute, ran into problems writing to the /tmp file.

See below for confirmation:

trial=# SET role log_user; -- changing from postgres user to log_user
SET

Now attempting the same COPY command, writing to the /tmp folder

trial=> COPY (SELECT expense_amt, member_status
FROM reward_members
WHERE member_status = 'gold_group')
TO '/tmp/awards_to_honor2.csv'
DELIMITER ','
CSV HEADER;
ERROR: must be superuser to COPY to or from a file
HINT: Anyone can COPY to stdout or from stdin. psql's \copy command also works for anyone.

Perhaps a better measure, as suggested in the HINT:, for roles without the SUPERUSER attribute, is the psql \copy meta-command.

Let's carry-out a similar type of command with \copy instead using the same role, without the need for that SUPERUSER attribute.

trial=> \copy (SELECT expense_amt, member_status
FROM reward_members
WHERE member_status = 'silver_group')
TO '/home/linux_user_here/more_awards.csv'
DELIMITER ','
CSV HEADER;
COPY 2

No problems there.

And the files' contents,

$ cat more_awards.csv
expense_amt,member_status
1001.55,silver_group
1097.99,silver_group

Also works for the /tmp folder:

trial=> \copy (SELECT expense_amt, member_status
FROM reward_members
WHERE member_status = 'silver_group')
TO '/tmp/more_awards.csv'
DELIMITER ','
CSV HEADER;
COPY 2

Same contents present in the written file as well:

trial=> \! cat /tmp/more_awards.csv
expense_amt,member_status
1001.55,silver_group
1097.99,silver_group

Why it matters?

Importing data into PostgreSQL via files is a surefire bulk upload method. Although all are not covered in this blog post, COPY and \copy both, offer several options for working with different file formats and extensions.

On the same token, exporting data from tables, or specific columns is easily handled with both of these commands as well.

8. psql \help meta-command

You're in a psql command-line session. Curious about the CREATE INDEX command syntax?

No need and going to a browser or another document.

Try this instead:

trial=> \help CREATE INDEX
Command: CREATE INDEX
Description: define a new index
Syntax:
CREATE [ UNIQUE ] INDEX [ CONCURRENTLY ] [ [ IF NOT EXISTS ] name ] ON table_name [ USING method ]
( { column_name | ( expression ) } [ COLLATE collation ] [ opclass ] [ ASC | DESC ] [ NULLS { FIRST | LAST } ] [, ...] )
[ WITH ( storage_parameter = value [, ... ] ) ]
[ TABLESPACE tablespace_name ]
[ WHERE predicate ]

To know what help text is available, you can run \help by itself and get a list of available options.

I won't list them all out here, just know that option is available.

Why it matters?

The fact this meta-command is super easy to use, powerful, and convenient are enough pros to mention it here. It's saved me tons of time spent searching throughout other documentation. And of course, being a newbie, I use it quite often!

Conclusion

This is not an exhaustive list. Nor the 'be all end all' of queries and data manipulation.

Only my take on those that pique my interest and speak to me as I continue to learn and grow into a SQL Developer role. I hope through this blog post, you will find use cases for the above queries and commands, implementing those where you see fit.

Ten Tips for Going into Production with PostgreSQL

$
0
0

Going into production is a very important task that must be carefully thought and planned beforehand. Some not so good decisions may be easily corrected afterwards, but some others not. So it is always better to spend that extra time in reading the official docs, books and research made by others early, than be sorry later. This is true for most computer systems deployments, and PostgreSQL is no exception.

System Initial Planning

Some decisions must be taken early on, before the system goes live. The PostgreSQL DBA must answer a number of questions: Will the DB run on bare metal, VMs or even containerized? Will it run on the organization’s premises or in the cloud? Which OS will be used? Is the storage going to be of spinning disks type or SSDs? For each scenario or decision, there are pros and cons and the final call will be made in cooperation with the stakeholders according to the organization’s requirements. Traditionally people used to run PostgreSQL on bare metal, but this has changed dramatically in the recent years with more and more cloud providers offering PostgreSQL as a standard option, which is a sign of the wide adoption and a result of increasing popularity of PostgreSQL. Independently of the specific solution, the DBA must ensure that the data will be safe, meaning that the database will be able to survive crashes, and this is the No1 criterion when making decisions about hardware and storage. So this brings us to the first tip!

Tip 1

No matter what the disk controller or disk manufacturer or cloud storage provider advertises, you should always make sure that the storage does not lie about fsync. Once fsync returns OK, the data should be safe on the medium no matter what happens afterwards (crash, power failure, etc). One nice tool that will help you test the reliability of your disks’ write-back cache is diskchecker.pl.

Just read the notes: https://brad.livejournal.com/2116715.html and do the test.

Use one machine to listen to events and the actual machine to test. You should see:

 verifying: 0.00%
 verifying: 10.65%
…..
 verifying: 100.00%
Total errors: 0

at the end of the report on the tested machine.

The second concern after reliability should be about performance. Decisions about system (CPU, memory), used to be much more vital since it was quite hard to change them later. But in today’s, in the cloud era, we can be more flexible about the systems that the DB runs on. The same is true for storage, especially in the early life of a system and while the sizes are still small. When the DB gets past the TB figure in size, then it gets harder and harder to change basic storage parameters without the need to entirely copy the database - or even worse, to perform a pg_dump, pg_restore. The second tip is about system performance.

Tip 2

Similarly to always testing the manufacturers’ promises regarding reliability, the same you should do about hardware performance. Bonnie++ is the most popular storage performance benchmark for Unix-like systems. For overall system testing (CPU, Memory and also storage) nothing is more representative than the DB’s performance. So the basic performance test on your new system would be running pgbench, the official PostgreSQL benchmark suite based on TCP-B.

Getting started with pgbench is fairly easy, all you have to do is:

postgres@debianpgsql1:~$ createdb pgbench
postgres@debianpgsql1:~$ pgbench -i pgbench
NOTICE:  table "pgbench_history" does not exist, skipping
NOTICE:  table "pgbench_tellers" does not exist, skipping
NOTICE:  table "pgbench_accounts" does not exist, skipping
NOTICE:  table "pgbench_branches" does not exist, skipping
creating tables...
100000 of 100000 tuples (100%) done (elapsed 0.12 s, remaining 0.00 s)
vacuum...
set primary keys...
done.
postgres@debianpgsql1:~$ pgbench pgbench
starting vacuum...end.
transaction type: <builtin: TPC-B (sort of)>
scaling factor: 1
query mode: simple
number of clients: 1
number of threads: 1
number of transactions per client: 10
number of transactions actually processed: 10/10
latency average = 2.038 ms
tps = 490.748098 (including connections establishing)
tps = 642.100047 (excluding connections establishing)
postgres@debianpgsql1:~$

You should always consult pgbench after any important change that you wish to assess and compare the results.

System Deployment, Automation and Monitoring

Once you go live it is very important to have your main system components documented and reproducible, to have automated procedures for creating services and recurring tasks and also have the tools to perform continuous monitoring.

Tip 3

One handy way to start using PostgreSQL with all its advanced enterprise features is ClusterControl by Severalnines. One can have an enterprise-class PostgreSQL cluster, just by hitting a few clicks. ClusterControl provides all those aforementioned services and many more. Setting up ClusterControl is fairly easy, just follow the instructions on the official documentation. Once you have prepared your systems (typically one for running CC and one for PostgreSQL for a basic setup) and done the SSH setup, then you must enter the basic parameters (IPs, Port nos, etc), and if all goes well you should see an output like the following:

And in the main clusters screen:

You can login to your master server and start creating your schema! Of course you can use as a basis the cluster you just created to further build up your infrastructure (topology). A generally good idea is to have a stable server file system layout and a final configuration on your PostgreSQL server and user/app databases before you start creating clones and standbys (slaves) based on your just created brand new server.

PostgreSQL layout, parameters and settings

At cluster initialization phase the most important decision is whether to use data checksums on data pages or not. If you want maximum data safety for your valued (future) data, then this is the time to do it. If there is a chance that you may want this feature in the future and you neglect to do it at this stage, you won’t be able to change it later (without pg_dump/pg_restore that is). This is the next tip:

Tip 4

In order to enable data checksums run initdb as follows:

$ /usr/lib/postgresql/10/bin/initdb --data-checksums <DATADIR>

Note that this should be done at the time of tip 3 we described above. If you already created the cluster with ClusterControl you’ll have to rerun pg_createcluster by hand, as at the time of this writing there is no way to tell the system or CC to include this option.

Another very important step before you go into production is planning for the server file system layout. Most modern linux distros (at least the debian-based ones) mount everything on / but with PostgreSQL normally you don’t want that. It is beneficial to have your tablespace(s) on separate volume(s), to have one volume dedicated for the WAL files and another one for pg log. But the most important is to move the WAL to its own disk. This brings us to the next tip.

Tip 5

With PostgreSQL 10 on Debian Stretch, you can move your WAL to a new disk with the following commands (supposing the new disk is named /dev/sdb ):

# mkfs.ext4 /dev/sdb
# mount /dev/sdb /pgsql_wal
# mkdir /pgsql_wal/pgsql
# chown postgres:postgres /pgsql_wal/pgsql
# systemctl stop postgresql
# su postgres
$ cd /var/lib/postgresql/10/main/
$ mv pg_wal /pgsql_wal/pgsql/.
$ ln -s /pgsql_wal/pgsql/pg_wal
$ exit
# systemctl start postgresql

It is extremely important to setup correctly the locale and encoding of your databases. Overlook this at the createdb phase and you’ll regret this dearly, as your app/DB moves into the i18n, l10n territories. The next tip shows just how to do that.

Tip 6

You should read the official docs and decide on your COLLATE and CTYPE (createdb --locale=) settings (responsible for sort order and character classification) as well as the charset (createdb --encoding=) setting. Specifying UTF8 as the encoding will enable your database to store multi-language text.

ClusterControl
Single Console for Your Entire Database Infrastructure
Find out what else is new in ClusterControl

PostgreSQL High Availability

Since PostgreSQL 9.0, when streaming replication became a standard feature, it became possible to have one or more readonly hot standbys, thus enabling the possibility to direct the read-only traffic to any of the available slaves. New plans exist for multimaster replication but at the point of this writing (10.3) it is only possible to have one read-write master, at least in the official open source product. For the next tip which deals with exactly this.

Tip 7

We will use our ClusterControl PGSQL_CLUSTER created in Tip 3. First we create a second machine which will act as our readonly slave (hot standby in PostgreSQL terminology). Then we click on Add Replication slave, and select our master and the new slave. After the job finishes you should see this output:

And the cluster now should look like:

Note the green “ticked” icon on the “SLAVES” label next to “MASTER”. You can verify that the streaming replication works, by creating a database object (database, table, etc) or inserting some rows in a table on the master and see the change on the standby.

The presence of the read-only standby enables us to perform load balancing for the clients doing select-only queries between the two servers available, the master and the slave. This takes us to tip 8.

Tip 8

You can enable load balancing between the two servers using HAProxy. With ClusterControl this fairly easy to do. You click to Manage->Load Balancer. After choosing your HAProxy server, ClusterControl will install everything for you: xinetd on all instances you specified and HAProxy on your HAProxy designated server. After the job has completed successfully you should see:

Note the HAPROXY green tick next to the SLAVES. Now you can test that HAProxy works:

postgres@debianpgsql1:~$ psql -h localhost -p 5434
psql (10.3 (Debian 10.3-1.pgdg90+1))
SSL connection (protocol: TLSv1.2, cipher: ECDHE-RSA-AES256-GCM-SHA384, bits: 256, compression: off)
Type "help" for help.
postgres=# select inet_server_addr();
 inet_server_addr
------------------
 192.168.1.61
(1 row)
--
-- HERE STOP PGSQL SERVER AT  192.168.1.61
--
postgres=# select inet_server_addr();
FATAL:  terminating connection due to administrator command
SSL connection has been closed unexpectedly
The connection to the server was lost. Attempting reset: Succeeded.
postgres=# select inet_server_addr();
 inet_server_addr
------------------
 192.168.1.60
(1 row)
postgres=#

Tip 9

Besides configuring for HA and load balancing, it is always beneficial to have some sort of connection pool in front of the PostgreSQL server. Pgpool and Pgbouncer are two projects coming from the PostgreSQL community. Many enterprise application servers provide their own pools as well. Pgbouncer has been very popular due to its simplicity, speed and the “transaction pooling” feature, by which, connection to the server is freed once the transaction ends, making it reusable for subsequent transactions which might come from the same session or a different one. The transaction pooling setting breaks some session pooling features, but in general the conversion to a “transaction pooling”-ready setup is easy and the cons are not so important in the general case. A common setup is to configure the app server’s pool with semi-persistent connections: A rather larger pool of connections per user or per app (which connect to pgbouncer) with long idle timeouts. This way connection time from the app is minimal while pgbouncer will help keep connections to the server as few as possible.

One thing that will most probably be of concern once you go live with PostgreSQL is understanding and fixing slow queries. The monitoring tools we mentioned in the previous blog like pg_stat_statements and also the screens of tools like ClusterControl will help you identify and possibly suggest ideas for fixing slow queries. However once you identify the slow query you’ll need to run EXPLAIN or EXPLAIN ANALYZE in order to see exactly the costs and times involved in the query plan. The next tip is about a very useful tool in order to do that.

Tip 10

You must run your EXPLAIN ANALYZE on your database, and then copy the output and paste it on the depesz’s explain analyze online tool and click submit. Then you will see three tabs: HTML, TEXT and STATS. HTML contains cost, time and number of loops for every node in the plan. The STATS tab shows per node type statistics. You should observe the “% of query” column, so that you know where your query exactly suffers.

As you get more familiar with PostgreSQL you’ll find many more tips on your own!

Top Backup Tools for PostgreSQL

$
0
0

PostgreSQL has the reputation of being rock solid from its beginnings, and over the years has accumulated a set of impressive features. However the peace of mind that your on-disk data is ACID compliant — if not complemented by an equivalent well thought backup strategy — can be easily shattered.

Backup Types

Before diving into the available tools, let’s look at the available PostgreSQL backup types and what their characteristics are:

SQL dumps (or logical)

  • Does not block readers or writers.
  • Geared towards small sets of data because of the negative impact on system load and the long time required for both backup and restore operations. The performance may be increased with the –no-sync flag, but refer to the man page for the risks associated with disabling the wait for writes.
  • A post-restore ANALYZE is required in order to optimize the statistics.
  • Global objects such as roles and tablespaces can only be backed up using pg_dumpall utility. Note that tablespace directories must be manually created prior to starting the restore.
  • Supports parallelism at the expense of increased system load. Read man pg_dump for its caveats and special requirements e.g. synchronized snapshots.
  • Dumps can be loaded in newer versions of PostgreSQL, or even another machine architecture, however they are not guaranteed to be backwards compatible between major versions so some manual editing of the dump file may be required.

Filesystem (or physical)

  • Requires the database to be shut down.
  • Faster than logical backups.
  • Includes cluster data.
  • Can only be restored on the same major version of PostgreSQL.

Continuous archiving (or Point In Time Recovery or PITR)

  • Suitable for very large databases where logical or physical backups would take too long.
  • Some directories inside the data directory can be excluded to speed up the process.

Snapshots

  • Requires operating system support — for example LVM works quite well which is also confirmed by NetBackup for PostgreSQL Agent.
  • Suitable for applications where both data directory and the database must be in sync e.g. LAMP applications, provided that the two snapshots are synchronized.
  • Not recommended when the database files are stored across multiple filesystems (must snapshot all filesystems simultaneously).

Cloud

All cloud providers implement backups in their PostgreSQL offering. Logical backups can be performed as usual, while physical backups and PITR are available through the cloud service offerings since access to the data store is not available (see for example Amazon Aurora for PostgreSQL). Therefore, backing up PostgreSQL in the cloud will need to be a topic for another blog.

Agent base

  • Requires an agent installed on targets.
  • Can do block-level backups e.g. COMMVAULT (installation supported on Windows only).

Features

While PostgreSQL provides out of the box the tools required to perform logical, physical, and PITR backups, specialized backup applications rely on the native PostgreSQL and operating system tools to fill the need of implementing a backup strategy that addresses the following points:

  • automation
  • frequency
  • retention period
  • integrity
  • ease of use

Additionally, PostgreSQL backup tools attempt to provide features common to generic backup tools such as:

  • incremental backups for saving storage space
  • backup catalogs
  • ability to store backups on premise or in the cloud
  • alerting and notification
  • comprehensive reporting
  • access control
  • encryption
  • graphical interface and dashboards
  • backups of remote hosts
  • adaptive throughput in order to minimize load on the targets
  • handling multiple hosts in parallel
  • backup orchestration e.g. jobs chaining
  • REST APIs

Lab Setup

For this exercise I’ve setup a command-and-control host that where I’ll be installing the backup tools, that also runs two PostgreSQL instances — 9.6 and 10 — installed from PGDG repositories:

[root@cc ~]# ps -o user,pid,ppid,args --forest -U postgres
USER       PID  PPID COMMAND
postgres  4535     1 /usr/pgsql-10/bin/postmaster -D /var/lib/pgsql/10/data/
postgres  4538  4535  \_ postgres: logger process
postgres  4540  4535  \_ postgres: checkpointer process
postgres  4541  4535  \_ postgres: writer process
postgres  4542  4535  \_ postgres: wal writer process
postgres  4543  4535  \_ postgres: autovacuum launcher process
postgres  4544  4535  \_ postgres: stats collector process
postgres  4545  4535  \_ postgres: bgworker: logical replication launcher
postgres  4481     1 /usr/pgsql-9.6/bin/postmaster -D /var/lib/pgsql/9.6/data/
postgres  4483  4481  \_ postgres: logger process
postgres  4485  4481  \_ postgres: checkpointer process
postgres  4486  4481  \_ postgres: writer process
postgres  4487  4481  \_ postgres: wal writer process
postgres  4488  4481  \_ postgres: autovacuum launcher process
postgres  4489  4481  \_ postgres: stats collector process

[root@cc ~]# netstat -npeelt | grep :543
tcp   0  0  127.0.0.1:5432  0.0.0.0:*  LISTEN  26  79972  4481/postmaster
tcp   0  0  127.0.0.1:5433  0.0.0.0:*  LISTEN  26  81801  4535/postmaster
tcp6  0  0  ::1:5432        :::*       LISTEN  26  79971  4481/postmaster
tcp6  0  0  ::1:5433        :::*       LISTEN  26  81800  4535/postmaster

I’ve also setup two remote PostgreSQL instances running the same versions 9.6 and respectively 10:

[root@db-1 ~]# ps -o user,pid,ppid,args --forest -U postgres
USER       PID  PPID COMMAND
postgres 10972     1 /usr/pgsql-9.6/bin/postmaster -D /var/lib/pgsql/9.6/data/
postgres 10975 10972  \_ postgres: logger process
postgres 10977 10972  \_ postgres: checkpointer process
postgres 10978 10972  \_ postgres: writer process
postgres 10979 10972  \_ postgres: wal writer process
postgres 10980 10972  \_ postgres: autovacuum launcher process
postgres 10981 10972  \_ postgres: stats collector process

[root@db-1 ~]# netstat -npeelt | grep :5432
tcp   0  0  0.0.0.0:5432  0.0.0.0:*  LISTEN  26  34864  10972/postmaster
tcp6  0  0  :::5432       :::*       LISTEN  26  34865  10972/postmaster


[root@db-2 ~]# ps -o user,pid,ppid,args --forest -U postgres
USER       PID  PPID COMMAND
postgres 10829     1 /usr/pgsql-10/bin/postmaster -D /var/lib/pgsql/10/data/
postgres 10831 10829  \_ postgres: logger process
postgres 10833 10829  \_ postgres: checkpointer process
postgres 10834 10829  \_ postgres: writer process
postgres 10835 10829  \_ postgres: wal writer process
postgres 10836 10829  \_ postgres: autovacuum launcher process
postgres 10837 10829  \_ postgres: stats collector process
postgres 10838 10829  \_ postgres: bgworker: logical replication launcher

[root@db-2 ~]# netstat -npeelt | grep :5432
tcp   0  0  0.0.0.0:5432  0.0.0.0:*  LISTEN  26  34242  10829/postmaster
tcp6  0  0  :::5432       :::*       LISTEN  26  34243  10829/postmaster

Next, use pgbench to create a data set:

pgbench=# \dt+
                          List of relations
 Schema |       Name       | Type  |  Owner   |  Size   | Description
--------+------------------+-------+----------+---------+-------------
 public | pgbench_accounts | table | postgres | 128 MB  |
 public | pgbench_branches | table | postgres | 40 kB   |
 public | pgbench_history  | table | postgres | 0 bytes |
 public | pgbench_tellers  | table | postgres | 40 kB   |
(4 rows)

Tools

A list of common backup tools can be found in the PostgreSQL Wiki — Backup section. I’ve augmented the list with products I’ve come across over the years and from a recent Internet search.

Amanda

Amanda is agent based, open source, and supports PostgreSQL out of the box via the ampgsql API. As of this writing, the version 3.5.1 does not support tablespaces (see man ampgsql).

Zmanda provides an enterprise version which is also open source, however not directly available for download as a trial.

Amanda requires a dedicated backup host as the server and client packages exclude each other:

[root@cc ~]# rpm -qp --conflicts ./amanda-backup_client-3.5.1-1.rhel7.x86_64.rpm
amanda-backup_server
[root@cc ~]# rpm -qp --conflicts ./amanda-backup_server-3.5.1-1.rhel7.x86_64.rpm
amanda-backup_client

Follow the basic configuration guide to setup the server and client then configure the PostgreSQL API.

Here’s a git diff from my lab:

  • Server:

    • increase the server backup space:

      --- a/etc/amanda/omiday/amanda.conf
      				+++ b/etc/amanda/omiday/amanda.conf
      				@@ -13,7 +13,7 @@ amrecover_changer "changer"
      
      				tapetype "TEST-TAPE"
      				define tapetype TEST-TAPE {
      				1.  length 100 mbytes
      				2.  length 500 mbytes
      					filemark 4 kbytes
      				}
      • define the PostgreSQL target (and disable sample backup):

        --- a/etc/amanda/omiday/disklist
        +++ b/etc/amanda/omiday/disklist
        @@ -1,3 +1,2 @@
        -localhost /etc simple-gnutar-local
        +#localhost /etc simple-gnutar-local
        +10.1.9.243 /var/lib/pgsql/9.6/data dt_ampgsql
  • Client:

    • config:

      --- /dev/null
      +++ b/etc/amanda/omiday/amanda-client.conf
      @@ -0,0 +1,5 @@
      +property "PG-DATADIR""/var/lib/pgsql/9.6/data"
      +property "PG-ARCHIVEDIR""/var/lib/pgsql/9.6/archive"
      +property "PG-HOST""/tmp"
      +property "PG-USER""amandabackup"
      +property "PG-PASSFILE""/etc/amanda/pg_passfile"
      • authentication file:

        --- /dev/null
        +++ b/etc/amanda/pg_passfile
        @@ -0,0 +1 @@
        +/tmp:*:*:amandabackup:pass
    • authorize the server:

      --- a/var/lib/amanda/.amandahosts
      +++ b/var/lib/amanda/.amandahosts
      @@ -1,2 +1,3 @@
      localhost amandabackup amdump
      localhost.localdomain amandabackup amdump
      +10.1.9.231 amandabackup amdump
    • PostgreSQL authentication:

      --- a/var/lib/pgsql/9.6/data/pg_hba.conf
      +++ b/var/lib/pgsql/9.6/data/pg_hba.conf
      @@ -79,7 +79,8 @@
      # "local" is for Unix domain socket connections only
      local   all             all                                     trust
      # IPv4 local connections:
      -host    all             all             127.0.0.1/32            ident
      +host    all             all             127.0.0.1/32            trust
      +host    all             amandabackup    10.1.9.243/32           trust
      # IPv6 local connections:
      host    all             all             ::1/128                 ident
      # Allow replication connections from localhost, by a user with the
    • PostgreSQL config:

      --- a/var/lib/pgsql/9.6/data/postgresql.conf
      +++ b/var/lib/pgsql/9.6/data/postgresql.conf
      @@ -178,6 +178,7 @@ dynamic_shared_memory_type = posix  # the default is the first option
      
      #wal_level = minimal                   # minimal, replica, or logical
                                             # (change requires restart)
      +wal_level = replica
      #fsync = on                            # flush data to disk for crash safety
                                                      # (turning this off can cause
                                                      # unrecoverable data corruption)
      @@ -215,10 +216,12 @@ dynamic_shared_memory_type = posix        # the default is the first option
      
      #archive_mode = off            # enables archiving; off, on, or always
                                    # (change requires restart)
      +archive_mode = on
      #archive_command = ''          # command to use to archive a logfile segment
                                    # placeholders: %p = path of file to archive
                                    #               %f = file name only
                                    # e.g. 'test ! -f /mnt/server/archivedir/%f && cp %p /mnt/server/archivedir/%f'
      +archive_command = 'test ! -f /var/lib/pgsql/9.6/archive/%f && cp %p /var/lib/pgsql/9.6/archive/%f'
      #archive_timeout = 0           # force a logfile segment switch after this
                                    # number of seconds; 0 disables

Once completed the above configuration, run the backup:

[amandabackup@cc ~]$ amdump omiday

And verify:

[amandabackup@cc ~]$ amreport omiday
Hostname: cc
Org     : omiday
Config  : omiday
Date    : April 14, 2018

These dumps were to tape MyData01.
The next tape Amanda expects to use is: MyData02.


STATISTICS:
                        Total       Full      Incr.   Level:#
                        --------   --------   --------  --------
Estimate Time (hrs:min)     0:00
Run Time (hrs:min)          0:00
Dump Time (hrs:min)         0:00       0:00       0:00
Output Size (meg)            0.1        0.0        0.1
Original Size (meg)         16.0        0.0       16.0
Avg Compressed Size (%)      0.5        --         0.5
DLEs Dumped                    1          0          1  1:1
Avg Dump Rate (k/s)         33.7        --        33.7

Tape Time (hrs:min)         0:00       0:00       0:00
Tape Size (meg)              0.1        0.0        0.1
Tape Used (%)                0.0        0.0        0.0
DLEs Taped                     1          0          1  1:1
Parts Taped                    1          0          1  1:1
Avg Tp Write Rate (k/s)    830.0        --       830.0


USAGE BY TAPE:
Label                 Time         Size      %  DLEs Parts
MyData01              0:00          83K    0.0     1     1


NOTES:
planner: tapecycle (3) <= runspercycle (3)
planner: Last full dump of 10.1.9.243:/var/lib/pgsql/9.6/data on tape MyData04 overwritten in 3 runs.
taper: tape MyData01 kb 83 fm 1 [OK]


DUMP SUMMARY:
                                                               DUMPER STATS   TAPER STATS
HOSTNAME     DISK                    L ORIG-KB  OUT-KB  COMP%  MMM:SS   KB/s MMM:SS   KB/s
-------------------------------------- ---------------------- -------------- -------------
10.1.9.243   /var/lib/pgsql/9.6/data 1   16416      83    0.5    0:02   33.7   0:00  830.0

(brought to you by Amanda version 3.5.1)

Restoring from backup involves more manual steps as explained in the restore section.

According to the Amanda Enterprise FAQ the following enhancement would apply to our PostgreSQL example:

  • management console for automation of backup, retention policies, and schedules
  • backup to Amazon S3 cloud storage

Barman

Barman is a disaster recovery solution for PostgreSQL maintained by 2ndQuadrant. It is designed to manage backups for multiple databases and has the ability to restore to a previous point in time using the PITR feature of PostgreSQL.

Barman’s features at a glance:

  • handles multiple targets
  • support for different PostgreSQL versions
  • zero data loss
  • streaming and/or standard archiving of WALs
  • local or remote recovery
  • simplified point in time recovery

As noted in the Barman Manual, support for incremental backups, parallel jobs, data deduplication, and network compression is available only when using the rsync option. Also, streaming WALs from a standby using the archive_command isn’t currently supported.

After following the instructions in the manual for setting up the environment we can verify:

-bash-4.2$ barman list-server
db1 - master
db2 - replica

-bash-4.2$ barman check db1
Server db1:
      PostgreSQL: OK
      is_superuser: OK
      PostgreSQL streaming: OK
      wal_level: OK
      replication slot: OK
      directories: OK
      retention policy settings: OK
      backup maximum age: OK (no last_backup_maximum_age provided)
      compression settings: OK
      failed backups: OK (there are 0 failed backups)
      minimum redundancy requirements: OK (have 0 backups, expected at least 0)
      pg_basebackup: OK
      pg_basebackup compatible: OK
      pg_basebackup supports tablespaces mapping: OK
      archive_mode: OK
      archive_command: OK
      continuous archiving: OK
      pg_receivexlog: OK
      pg_receivexlog compatible: OK
      receive-wal running: OK
      archiver errors: OK

-bash-4.2$ barman check db2
Server db2:
      PostgreSQL: OK
      is_superuser: OK
      PostgreSQL streaming: OK
      wal_level: OK
      replication slot: OK
      directories: OK
      retention policy settings: OK
      backup maximum age: OK (no last_backup_maximum_age provided)
      compression settings: OK
      failed backups: OK (there are 0 failed backups)
      minimum redundancy requirements: OK (have 0 backups, expected at least 0)
      pg_basebackup: OK
      pg_basebackup compatible: OK
      pg_basebackup supports tablespaces mapping: OK
      archive_mode: OK
      archive_command: OK
      continuous archiving: OK
      pg_receivexlog: OK
      pg_receivexlog compatible: OK
      receive-wal running: OK
      archiver errors: OK

Everything checks OK, so we can test by backing up the two hosts:

-bash-4.2$ barman backup db1
Starting backup using postgres method for server db1 in /var/lib/barman/db1/base/20180414T091155
Backup start at LSN: 0/240001B0 (000000010000000000000024, 000001B0)
Starting backup copy via pg_basebackup for 20180414T091155
Copy done (time: 2 seconds)
Finalising the backup.
This is the first backup for server db1
WAL segments preceding the current backup have been found:
      000000010000000000000023 from server db1 has been removed
Backup size: 201.9 MiB
Backup end at LSN: 0/26000000 (000000010000000000000025, 00000000)
Backup completed (start time: 2018-04-14 09:11:55.783708, elapsed time: 2 seconds)
Processing xlog segments from file archival for db1
      000000010000000000000023
      000000010000000000000024
      000000010000000000000025.00000028.backup
Processing xlog segments from streaming for db1
      000000010000000000000024

-bash-4.2$ barman backup db2
Starting backup using postgres method for server db2 in /var/lib/barman/db2/base/20180414T091225
Backup start at LSN: 0/B0000D0 (00000001000000000000000B, 000000D0)
Starting backup copy via pg_basebackup for 20180414T091225
Copy done (time: 3 seconds)
Finalising the backup.
This is the first backup for server db2
WAL segments preceding the current backup have been found:
      000000010000000000000009 from server db2 has been removed
      00000001000000000000000A from server db2 has been removed
Backup size: 196.8 MiB
Backup end at LSN: 0/D000000 (00000001000000000000000C, 00000000)
Backup completed (start time: 2018-04-14 09:12:25.619005, elapsed time: 3 seconds)
Processing xlog segments from file archival for db2
      00000001000000000000000B
      00000001000000000000000C.00000028.backup
Processing xlog segments from streaming for db2
      00000001000000000000000B

List the backup catalog:

-bash-4.2$ barman list-backup all
db1 20180414T091155 - Sat Apr 14 09:11:58 2018 - Size: 217.9 MiB - WAL Size: 0 B
db2 20180414T091225 - Sat Apr 14 09:12:28 2018 - Size: 212.8 MiB - WAL Size: 0 B

Displaying the contents for a particular backup:

-bash-4.2$ barman list-files db1 20180414T091155 | head
/var/lib/barman/db1/base/20180414T091155/backup.info
/var/lib/barman/db1/base/20180414T091155/data/backup_label
/var/lib/barman/db1/base/20180414T091155/data/PG_VERSION
/var/lib/barman/db1/base/20180414T091155/data/postgresql.auto.conf
/var/lib/barman/db1/base/20180414T091155/data/pg_ident.conf
/var/lib/barman/db1/base/20180414T091155/data/postgresql.conf
/var/lib/barman/db1/base/20180414T091155/data/pg_hba.conf

When Barman was configured for synchronous WAL streaming we can verify the replication status:

-bash-4.2$ barman replication-status db1
Status of streaming clients for server 'db1':
Current LSN on master: 0/26000528
Number of streaming clients: 1

1. Async WAL streamer
   Application name: barman_receive_wal
   Sync stage      : 3/3 Remote write
   Communication   : TCP/IP
   IP Address      : 10.1.9.231 / Port: 37278 / Host: -
   User name       : streaming_barman
   Current state   : streaming (async)
   Replication slot: barman
   WAL sender PID  : 2046
   Started at      : 2018-04-14 09:04:03.019323+00:00
   Sent LSN   : 0/26000528 (diff: 0 B)
   Write LSN  : 0/26000528 (diff: 0 B)
   Flush LSN  : 0/26000000 (diff: -1.3 KiB)

Further enhancements can be added using the provided hook scripts.

Finally, for command line lovers, Barman comes with full TAB completion.

EDB Backup and Recovery Tool (BART)

EDB BART is a closed source proprietary application provided by EnterpriseDB. It combines the PostgreSQL native Filesystem Level Backup and PITR into an easy to use tool providing the following features:

  • retention policies
  • incremental backups
  • complete, hot, physical backups of multiple Postgres Plus Advanced Server and PostgreSQL database servers
  • backup and recovery management of the database servers on local or remote hosts
  • centralized catalog for backup data
  • store backup data in compressed format
  • checksum verification

While the trial version for the latest version v2.1 is not freely available, the article Data Backup Made Easy and the product documentation guide offer some information for those curious to learn more.

ClusterControl
Single Console for Your Entire Database Infrastructure
Find out what else is new in ClusterControl

pgBackRest

pgBackRest implements a full system backup that doesn’t rely on the common tools tar and rsync. It is currently hosted and made available by CrunchyData under an MIT license. See Recognition for details on its origins.

It offers all the features one would expect from a PostgreSQL centric tool:

  • high backup/restore throughput
  • full, incremental, and differential backups
  • retention policies
  • backup and restore integrity verification through file checksums and integration with PostgreSQL page checksums.
  • ability to resume backups
  • streaming compression and checksums
  • Amazon S3 cloud storage support
  • Encryption

..and much more. Refer to the project page for details.

The installation requires a 64-bit Linux/Unix system and it is outlined in the user guide. The guide also introduces the reader to the main concepts, very useful to those new to PostgreSQL or storage technology.

Although the guide uses command examples for Debian/Ubuntu the pgBackRest is available in the PGDG yum repository, and the installer will pull in all the dependencies:

Installing:

pgbackrest       x86_64  2.01-1.rhel7     pgdg10  36k

Installing       for     dependencies:
perl-DBD-Pg      x86_64  2.19.3-4.el7     base    195k
perl-DBI         x86_64  1.627-4.el7      base    802k
perl-Digest-SHA  x86_64  1:5.85-4.el7     base    58k
perl-JSON-PP     noarch  2.27202-2.el7    base    55k
perl-Net-Daemon  noarch  0.48-5.el7       base    51k
perl-PlRPC       noarch  0.2020-14.el7    base    36k
perl-XML-LibXML  x86_64  1:2.0018-5.el7   base    373k
perl-version     x86_64  3:0.99.07-2.el7  base    84k

Let’s setup two clusters, pg96 and pg10, each having one node:

  • control node (“repository” in the guide):

    [root@cc ~]# cat /etc/pgbackrest.conf
    [global]
    repo1-path=/var/lib/pgbackrest
    repo1-retention-full=2
    start-fast=y
    
    [pg96]
    pg1-path=/var/lib/pgsql/9.6/data
    pg1-host=db1
    pg1-host-user=postgres
    
    [pg10]
    pg1-path=/var/lib/pgsql/10/data
    pg1-host=db2
    pg1-host-user=postgres
  • cluster #1:

    [root@db-1 ~]# cat /etc/pgbackrest.conf
    [global]
    log-level-file=detail
    repo1-host=repository
    
    [pg96]
    pg1-path=/var/lib/pgsql/9.6/data
  • cluster #2:

    [root@db-2 ~]# cat /etc/pgbackrest.conf
    [global]
    log-level-file=detail
    repo1-host=repository
    
    [pg10]
    pg1-path=/var/lib/pgsql/10/data

Next, run backups and display the backup catalog:

-bash-4.2$ pgbackrest --stanza=pg96 info
stanza: pg96
   status: ok

   db (current)
      wal archive min/max (9.6-1): 00000001000000000000003D / 00000001000000000000003D

      full backup: 20180414-120727F
            timestamp start/stop: 2018-04-14 12:07:27 / 2018-04-14 12:08:01
            wal start/stop: 00000001000000000000003D / 00000001000000000000003D
            database size: 185.6MB, backup size: 185.6MB
            repository size: 12.1MB, repository backup size: 12.1MB
-bash-4.2$ pgbackrest --stanza=pg10 info
stanza: pg10
   status: ok

   db (current)
      wal archive min/max (10-1): 000000010000000000000012 / 000000010000000000000012

      full backup: 20180414-120810F
            timestamp start/stop: 2018-04-14 12:08:10 / 2018-04-14 12:08:38
            wal start/stop: 000000010000000000000012 / 000000010000000000000012
            database size: 180.5MB, backup size: 180.5MB
            repository size: 11.6MB, repository backup size: 11.6MB

pgBackRest supports parallelizing of backup and restore — following the example in the guide, we are backing with one CPU and then update the config to use 2 CPUs:

--- a/etc/pgbackrest.conf
+++ b/etc/pgbackrest.conf
@@ -2,6 +2,7 @@
repo1-path=/var/lib/pgbackrest
repo1-retention-full=2
start-fast=y
+process-max=2

[pg96]
pg1-host=db1

The result:

-bash-4.2$ pgbackrest --stanza=pg96 info
stanza: pg96
    status: ok

    db (current)
        wal archive min/max (9.6-1): 00000001000000000000003D / 000000010000000000000041

        full backup: 20180414-120727F
            timestamp start/stop: 2018-04-14 12:07:27 / 2018-04-14 12:08:01
            wal start/stop: 00000001000000000000003D / 00000001000000000000003D
            database size: 185.6MB, backup size: 185.6MB
            repository size: 12.1MB, repository backup size: 12.1MB

        incr backup: 20180414-120727F_20180414-121434I
            timestamp start/stop: 2018-04-14 12:14:34 / 2018-04-14 12:14:52
            wal start/stop: 00000001000000000000003F / 00000001000000000000003F
            database size: 185.6MB, backup size: 8.2KB
            repository size: 12.1MB, repository backup size: 431B
            backup reference list: 20180414-120727F

        incr backup: 20180414-120727F_20180414-121853I
            timestamp start/stop: 2018-04-14 12:18:53 / 2018-04-14 12:19:08
            wal start/stop: 000000010000000000000041 / 000000010000000000000041
            database size: 185.6MB, backup size: 8.2KB
            repository size: 12.1MB, repository backup size: 429B
            backup reference list: 20180414-120727F

With 2 CPUs the backup ran almost 20% faster which can make a big difference when running against a large data set.

Conclusion

PostgreSQL centric backup tools offer, as expected, more options than general purpose tools. Most PostgreSQL backup tools offer the same core functionality, but their implementation introduces limitations that can only be discovered by carefully following the documentation to test drive the product.

In addition, ClusterControl offers an array of backup and restore features that you can use as part of your database management setup.

Viewing all 350 articles
Browse latest View live